Project context
- Video: Racial Egalitarianism: All Arguments Ranked & Debunked
- Transcript source: YouTube automatic English captions, retrieved 2026-09-02
- Research status: Transcript and visual-evidence fact-check complete; provenance remains open where direct borrowing cannot be established.
Attribution boundary
The transcript comes from YouTube’s automatic English captions and was checked against the video. The scientific and historical verdicts below are this dossier’s assessment. Similar wording, numbers, or graphics in an earlier source establish a possible source lineage, not proof that Basic Logic copied that source.
Executive verdict
Bottom line
The video begins with several defensible propositions—intelligence is measurable and partly heritable within studied populations; populations can differ greatly at locally adaptive alleles; culture and genes can interact; and IQ predicts some later outcomes. It then treats those propositions as if they demonstrated a genetic explanation for contemporary racial-group differences in intelligence, personality, crime, culture, immigration outcomes, and social cohesion. That conclusion does not follow from the evidence presented.
The decisive error is a repeated shift in the unit of inference:
individual differences within a studied population are partly heritable       supported
                              ↓
racial-group mean differences must therefore be genetic                        does not follow
                              ↓
the Minnesota adoption categories isolate that genetic effect                  false; major confounding
                              ↓
selected local adaptations establish racial cognitive hierarchies              does not follow
                              ↓
national IQ maps measure innate racial intelligence                            not established
                              ↓
groups are genetically suited to different cultures and societies              unsupported
The strongest narrow point in the video’s favor is that denying all genetic influence on cognitive ability would be wrong. Modern twin, adoption, and genomic studies support substantial genetic contributions to individual differences in intelligence. The video’s target, however, is not merely that absolute denial. Its larger claim is about the causes of differences among broad racial groups. Within-group heritability does not determine between-group causation, even when heritability is high.
Revised claim-by-claim fact-check
| Timestamp | Video claim | Verdict | What the evidence supports |
|---|---|---|---|
| 0:00–1:23 | Mainstream leftists think every disparity is discrimination, while the mainstream right thinks culture explains everything. | Straw-man framing | Some advocates do make monocausal claims, but contemporary work examines interacting genetic, developmental, institutional, economic, historical, geographic, and discriminatory mechanisms. Discrediting two caricatures does not establish the video’s preferred genetic explanation. |
| 1:00–1:23 | Broad groups may be innately different and create different outcomes even without outside forces. | Hypothesis, not demonstrated | This is a possible class of hypothesis only after the trait, population, genetic measure, environment, and causal design are specified. The video later supplies examples of individual heritability and local adaptation, not a valid test of this broad causal claim. |
| 2:02–2:20 | Intelligence is heritable; twin and adoption studies show that it is genetically influenced. | Supported in the ordinary within-population sense | Intelligence is a polygenic trait and individual differences are substantially heritable in many studied populations. Heritability is population- and environment-specific and does not by itself identify why two socially or ancestrally defined groups have different means. |
| 2:20–2:37 | The Minnesota Transracial Adoption Study showed Black adoptees averaged 89 while white adoptees averaged 106 despite being raised by comparable upper-middle-class white families. | Numbers approximately authentic; causal representation misleading | At adolescent follow-up the reported means were 89.4 and 105.6. But the two groups were small, did not have equal prenatal or pre-adoption histories, differed in age and quality of placement, and were exposed to different social treatment. The study’s authors said biological and social variables could not be disentangled. |
| 2:20–2:51 | The adoption result, plus heritability and evolution, makes racial selection for intelligence the reasonable conclusion. | Unsupported inference | The study was not randomized by ancestry, did not genotype cognitive variants, lacked direct parental-IQ data for the adoptees, and contained correlated placement differences. The result is compatible with multiple causal models. |
| 2:26–2:51 | Dog-breed intelligence differences illustrate why racial-group cognitive differences should be genetic. | Misleading analogy | Modern breeds underwent recent bottlenecks, closed breeding, and intense artificial selection for specialized traits. Human populations are not dog breeds, and breed comparison cannot estimate the genetic cause of a human group difference. |
| 2:51–3:24 | Humans and dog–wolf pairs can each be called roughly 99.9% identical; therefore high overall similarity says little about important behavioral differences. | Partly true principle; imprecise statistic and invalid application | Small sequence differences can have important effects. But percent identity depends on the sequences and variants counted. Dog and wolf demography, domestication, artificial selection, and taxonomic history do not supply evidence about the causes of racial IQ differences. |
| 3:24–3:49 | Aggression, impulse control, and personality are genetically influenced. | Broadly true for individual variation; group inference absent | Many behavioral traits show heritability, usually with substantial environmental influence and measurement dependence. That does not establish the direction, magnitude, or genetic cause of a difference among broad racial categories. |
| 3:49–4:20 | More genetic variation occurs within populations than between races, but this does not make all population differences inconsequential. | Important and substantially correct qualification | The finding that most human genetic diversity occurs within populations is robust. It does not mean every allele frequency is identical or that ancestry cannot be inferred. Conversely, the existence of ancestry-informative or locally adaptive variants does not validate claims about intelligence, personality, or social cohesion. |
| 4:20–4:37 | A Duffy-negative mutation occurs in 95–100% of West and Central Africans, in 0% of people without African ancestry, and makes carriers immune to malaria. | Real adaptation, overstated | The erythrocyte-silent Duffy allele is near fixation in many West and Central African populations and strongly reduces susceptibility to Plasmodium vivax. It is not confined absolutely to people with African ancestry, does not confer immunity to all malaria, and documented P. vivax infections occur in Duffy-negative people. |
| 4:37–4:47 | Tibetan EPAS1 occurs about 90% of the time, 0% in Africans and Europeans, and allows Tibetans to survive at high altitude. | Real adaptation, oversimplified | Tibetan high-altitude adaptation includes a high-frequency selected EPAS1 haplotype plus other loci and physiological responses. Published estimates vary by sample; a recent review cites a dominant haplotype frequency around 72%. The variant affects hypoxia-related physiology, but survival is not an all-or-none single-gene property. |
| 4:47–5:04 | ABCC11 makes 80–95% of East Asians have no sweat odor and is practically absent elsewhere. | Partly based on a real variant; inaccurate wording | The rs17822931 A allele is common in East Asia, determines dry earwax in AA homozygotes, and reduces secretion of axillary odor precursors. Everyone does not either have or lack “the ABCC11 gene”; the relevant variant occurs on a worldwide frequency cline, and “no sweat odor” is too absolute. |
| 5:04–5:26 | Because intelligence and personality are polygenic and heritable, group differences in them are a reasonable extension of the adaptive-locus examples. | Unsupported analogy across genetic architectures | Duffy, EPAS1, and ABCC11 are comparatively tractable locus-specific adaptations. Complex cognition and personality involve many variants of tiny effect, developmental pathways, gene–environment correlation, and measurement differences. One class of evidence cannot be substituted for the other. |
| 5:26–6:11 | Saying race is socially constructed is wordplay denying observable biological reality. | Misrepresents the claim | Genetic ancestry and population structure are biologically real. “Race is socially constructed” means the boundaries, labels, membership rules, and hierarchy of racial categories vary across societies and are not discrete genomic taxa. The National Academies explicitly distinguishes race from genetic similarity and ancestry. |
| 6:11–6:44 | IQ tests are imperfect but the best available measure and predictive of success. | Substantially supported, but too sweeping | General cognitive tests have meaningful reliability and predict education, occupational attainment, job performance, and income to different degrees. Prediction is probabilistic, varies by criterion and context, and does not establish genetic causes of group means. |
| 6:18–6:44 | The displayed world-IQ map reveals meaningful identity patterns. | Source and measurement problem | The image matches the widely circulated Lynn–Vanhanen national-IQ map. Those national estimates combine heterogeneous tests, small or unrepresentative samples, and—in some versions—geographic imputation. They are not a direct global experiment holding nutrition, schooling, disease, language, wealth, and test familiarity constant. |
| 6:44–7:06 | IQ predicts success better than being born rich. | Needs qualification | A longitudinal meta-analysis found intelligence predicted education and occupation strongly and income more modestly; parental SES also predicted outcomes. “Better” depends on the outcome, measurement, age, and model. Neither variable is a complete causal explanation. |
| 6:44–7:21 | If low-IQ groups perform poorly in Western society, they should not be imported; no society exists where higher IQ is not advantageous. | Normative non sequitur | Even a valid predictive association does not decide immigration policy. Policy also involves individual variation, age, education, skills, family ties, humanitarian obligations, labor demand, fiscal effects, institutions, and selection among migrants. A group average cannot determine an individual’s ability or rights. |
| 7:21–8:47 | Genes predate culture, so genes are the root cause of culture; groups are innately compatible with different cultures. | False temporal and causal inference | Cultural transmission can change much faster than genes and can create new selective environments. Dairying and lactase persistence are a classic culture-to-gene example. Gene–culture coevolution is reciprocal; the fact that genes existed first does not make genes the proximate cause of every later institution or norm. |
Visual and source audit
Minnesota Transracial Adoption Study slide
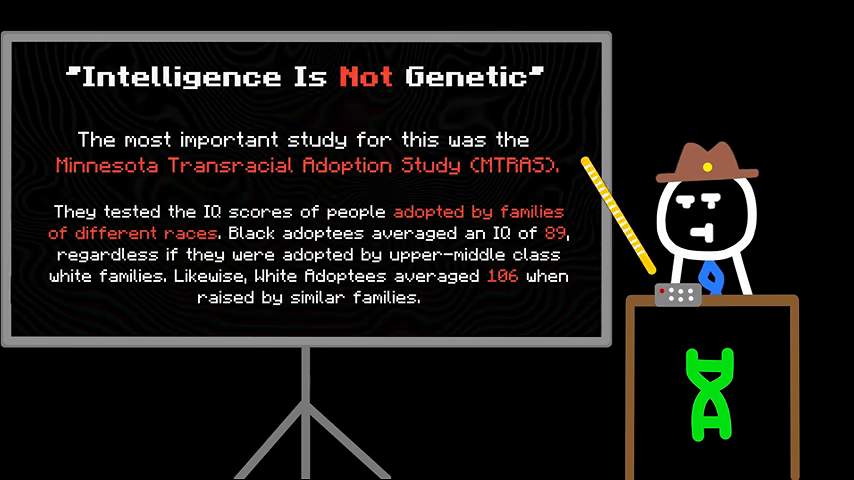
The slide accurately reproduces two adolescent group means from Weinberg, Scarr, and Waldman (1992), but it transforms a confounded observational comparison into an environmental-control experiment.
Important omitted information includes:
- the adolescent follow-up groups were only 21 adoptees classified as having two Black biological parents and 16 adoptees with two white biological parents in the commonly reproduced table;
- the mixed Black–white adoptee group, whose mean was approximately 99, is omitted from the slide;
- the Black/Black group was adopted later, experienced more and poorer-quality pre-adoptive placements, and differed in biological-parent education;
- the adoptees’ birth-parent IQs were not directly measured in a way that isolates a genetic effect;
- racial classification also changed social experience after adoption, so “same household class” did not equal the same total developmental environment;
- the original authors concluded that biological and social characteristics were confounded and that their data could not isolate a racial genetic cause.
The primary paper is unusually explicit: it states that parental race subsumed “a number of biological and social differences,” that the groups differed in placement experiences, and that the two types of variables remained impossible to disentangle. It nevertheless interpreted the overall longitudinal evidence as showing a large role for social environment. Weinberg, Scarr, and Waldman 1992
This does not prove that genes contribute nothing to cognitive variation or that every group mean is wholly environmental. It means the study cannot bear the specific causal weight the video places on it. A recent review reports that placement-history variables predicted substantial IQ variance in this sample, reinforcing the original confounding problem. McGue et al. 2026
World-IQ map
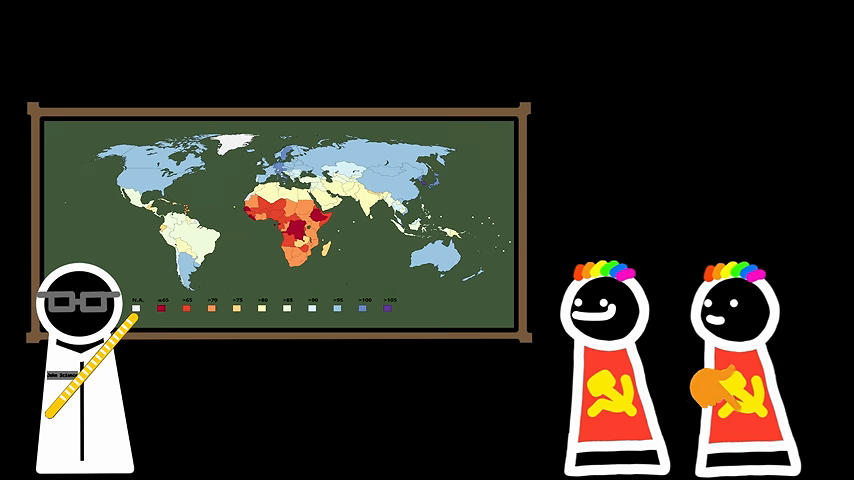
The map visually matches the widely circulated “World IQ Map” based on estimates associated with Richard Lynn and Tatu Vanhanen. The video supplies no visible citation or methodological warning. The map compresses several different operations into one color:
different tests + different ages + different sampling frames
            + different years + some estimated or imputed country values
                                  ↓
                         one national color
                                  ↓
                 treated in the video as group biology
That last step is invalid. National test performance can correlate with education, disease burden, nutrition, wealth, and institutional capacity and still be measured with uneven data. A peer-reviewed demographic review reports that many Lynn–Becker country estimates relied on small or unrepresentative samples, with only a minority of samples meeting the compilers’ own “national” criterion. Sear 2022 The European Human Behaviour and Evolution Association records that it issued a 2020 warning about poor-quality national-IQ datasets. EHBEA history
Study and concept audits
Intelligence heritability: what the video gets right and what it does not
The denial that genes influence intelligence is untenable. Genome-wide, twin, family, and adoption studies consistently find that inherited differences contribute to variation among individuals. A major review describes intelligence as highly polygenic and reports substantial heritability in studied populations. Plomin and von Stumm 2018
But heritability is a variance statistic for a defined population in a defined range of environments. The following can both be true:
Within population A, individual IQ variation is substantially heritable.
Between populations A and B, an observed mean difference is largely environmental.
The standard analogy is height: height can be highly heritable within two populations while their mean difference is produced by nutrition. This is not proof that IQ gaps are environmental; it demonstrates why within-group heritability alone cannot answer the between-group question. Formal quantitative-genetic analysis reaches the same conclusion. Feldman and Ramachandran 2024
To establish a racial genetic contribution, the video would need population-appropriate causal variants or validated polygenic measures, comparable phenotypes, controls for population stratification and indirect genetic effects, direct environmental measurement, and replication. It supplies none of these.
More variation within populations than between them
The video is right that the familiar variance result should not be paraphrased as “populations never differ at any important locus.” Lewontin’s original estimate placed about 85% of diversity within populations, and later marker sets retain the qualitative conclusion that within-population diversity dominates. Population structure can still allow probabilistic ancestry inference from many loci. Winther et al. 2022
The error comes next: three real adaptive examples are used as a bridge to unmeasured cognitive and cultural traits. The correct inference is only that some allele frequencies differ and some differences are functional. Each proposed behavioral difference still needs its own evidence.
Duffy, EPAS1, and ABCC11
| Example | Genuine result | Video’s exaggeration | Relevance to racial IQ claim |
|---|---|---|---|
| Duffy erythrocyte-silent allele | Very high frequency or near fixation in many sub-Saharan populations; strong protection against P. vivax | “Immune to malaria”; 0% outside African ancestry | Demonstrates local adaptation, not cognitive-group differences |
| Tibetan EPAS1 haplotype | Strong selection and association with hypoxia-related physiology | One variant “allows” survival; fixed 90% versus 0% everywhere else | Demonstrates high-altitude adaptation, not personality or civilization |
| ABCC11 rs17822931 | East Asian frequency peak; AA genotype causes dry earwax and reduces axillary odor precursors | People “have no sweat odor”; variant practically nonexistent elsewhere | Demonstrates a trait-associated frequency cline, not social cohesion |
Primary or major reviews: Duffy global distribution, Duffy and P. vivax systematic review, Tibetan high-altitude genetics, and ABCC11 earwax variant.
Race, ancestry, and social construction
The video’s rebuttal only works by redefining “social construct” as “imaginary.” That is not what the scientific claim means.
| Concept | What it describes |
|---|---|
| Genetic ancestry | Patterns of biological descent and genetic similarity inferred relative to sampled reference populations |
| Population structure | Statistical allele-frequency patterns produced by migration, drift, isolation, and selection |
| Race | Historically variable social classification systems that group and rank people using selected ancestry-linked or visible features |
Race can correlate imperfectly with ancestry because societies often classify people partly by appearance and presumed descent. The correlation does not make modern racial boundaries timeless, discrete biological subspecies. The 2023 National Academies framework specifically warns researchers not to use race as a proxy for human genetic variation or assume homogeneity and fixed group boundaries. National Academies
IQ validity and socioeconomic prediction
The video is on firmer ground when it says IQ tests contain useful information. Cognitive-test scores are meaningfully reliable and predictive, not arbitrary. A longitudinal meta-analysis found that intelligence predicted educational and occupational outcomes and, more modestly, income; it also compared intelligence with parental socioeconomic status and academic performance. Strenze 2007
Three distinctions remain essential:
- Predictive validity is not perfect prediction. Large individual overlap remains between any two group distributions.
- Prediction is not causal decomposition. A test can predict an outcome influenced by schooling, health, family resources, motivation, discrimination, and institutions.
- Individual prediction is not a genetic explanation of a group mean. The latter requires evidence about why the groups differ.
Genes and culture
Gene–culture coevolution is real, but the video’s one-way diagram is not. Culture can expose genetic variation to selection, buffer environmental pressures, change mating and migration, and spread adaptively without awaiting genetic change. Dairying preceding selection for adult lactase persistence is the canonical counterexample to “genes came first, therefore genes caused the culture.” Reviews describe culture as a faster inheritance system that can create novel selective environments. Richerson, Boyd, and Henrich 2010
Cross-cutting methodological errors
- Heritability transposition: a within-population variance estimate is used to explain between-group means.
- Equal-SES fallacy: adoptive-family class is treated as if it equalized prenatal, pre-placement, neighborhood, peer, discrimination, and developmental histories.
- Breed substitution: artificial selection among closed dog breeds is substituted for a quantitative model of human population differences.
- Adaptive-locus substitution: Duffy, EPAS1, and ABCC11 stand in for evidence about intelligence and personality that was never produced.
- Race–ancestry equivocation: real population structure is treated as validating any historically contingent racial taxonomy.
- Map reification: heterogeneous national test estimates are treated as direct measurements of innate racial potential.
- Prediction–cause confusion: IQ’s predictive value is presented as proof of the genetic cause of group outcomes.
- Genetic-first temporal fallacy: because genes predate human culture, genes are declared the root cause of particular modern cultures.
- Group-to-individual policy leap: uncertain group averages are used to justify conclusions about migrants without an individual-level policy model.
Source-provenance investigation
Minnesota adoption numbers
The exact adolescent sequence—approximately 106 white, 99 mixed, 89 Black—has circulated for decades in hereditarian and racialist literature. Examples include:
- a 1994 American Renaissance treatment of the study;
- J. Philippe Rushton articles from the late 1990s;
- Rushton and Arthur Jensen’s 2005 review, whose table reproduces the group sequence and sample sizes;
- Michael H. Hart’s later popular treatment of race and history.
The video displays only the Black and white endpoint means and calls the rearing families “similar,” a compression common in this secondary literature. This supports a source-lineage hypothesis, but the primary paper itself contains the numbers, so it does not prove that Basic Logic used Rushton, Jensen, Hart, or American Renaissance. The provenance signal becomes stronger only if wording, table design, omitted categories, citation order, or a distinctive error matches an earlier source.
National-IQ map
The displayed map matches the long-circulating Lynn–Vanhanen 2002 world-IQ graphic rather than a newly constructed chart. That links the video to the national-IQ citation ecosystem even though the narration does not name Lynn or Vanhanen. Future image-lineage work should compare the exact crop, legend, attribution remnant, and resolution against copies on Wikipedia-derived mirrors, Richard Lynn–associated archives, and race/IQ compilations.
Reused argumentative architecture
This video and The Genetics Behind Unequal Societies share more than a topic:
| Recurring move | Racial Egalitarianism video | Genetics Behind Unequal Societies video |
|---|---|---|
| Start from a true genetic fact | Intelligence heritability and adaptive alleles | Population structure and differentiated SNPs |
| Use dogs or wolves as intuition | Chihuahua/Border Collie and dog/wolf behavior | Dogs, wolves, breeds, and hybrid adaptation |
| Move from individual or local genetics to broad races | Heritability → racial intelligence | Gene enrichment → racial neurology |
| Move from races to societies | Genes produce culture and assimilation limits | Neurologies produce civilizations and political systems |
| Use low-dimensional or aggregate evidence as causal | National-IQ map | Ancestry PCA and ancestry–SES table |
| Policy implication | Restrict low-IQ immigration | Favor ancestry-specific or homogeneous societies |
The recurrence suggests a stable channel framework: population difference → presumed behavioral heredity → civilizational compatibility → political prescription. Later video notes should test whether the cited facts change while this inference template remains constant.
What evidence would be needed for the video’s larger thesis?
- comparable cognitive phenotypes from representative samples rather than a heterogeneous national map;
- measured genomic predictors validated within every relevant ancestry group;
- controls for population stratification, assortative mating, indirect parental genetic effects, and environmental confounding;
- family-based or natural-experiment designs capable of distinguishing inherited effects from social treatment;
- direct estimates of the genetic contribution to the between-group mean, not only within-group heritability;
- a specified and tested mechanism linking cognitive variants to culture, assimilation, or institutional outcomes;
- independent replication and predictions that could falsify the hereditarian model.
Final assessment
The video successfully rebuts the absolute claim that genes never influence intelligence or behavior. It does not rebut the scientifically distinct claim that current evidence fails to establish a genetic cause for broad racial-group differences in intelligence, culture, or social outcomes. Its adaptive-gene examples are real but irrelevant to the main causal inference; its Minnesota numbers are authentic but presented as more controlled and decisive than the study permits; and its world-IQ map is not reliable evidence of racial genetic rankings.
Onscreen evidence and source provenance
The two most consequential screenshots are preserved above. Additional temporary frame review confirmed that the video does not display primary citations for the adaptive-locus claims or the national-IQ map. The video description names twin studies, adoption research, the Minnesota Transracial Adoption Study, heritability data, and evolutionary biology but supplies no bibliography.
Cross-video connections
- Basic Logic Youtube Channel Research
- Basic Logic Cross-Video Claim Map
- The Genetics Behind Unequal Societies
Source register
- Weinberg, Richard A., Sandra Scarr, and Irwin D. Waldman. 1992. “The Minnesota Transracial Adoption Study: A Follow-Up of IQ Test Performance at Adolescence.” Intelligence 16:117–135.
- Matthews, Lucas J., and Eric Turkheimer. 2026. “Was the Minnesota Transracial Adoption Study Abhorrent or Just Controversial?” Behavior Genetics. DOI
10.1007/s10519-026-10275-z. - McGue, Matthew, et al. 2026. “Durable Lessons on Intelligence from Twin and Adoption Research.” Behavior Genetics.
- Plomin, Robert, and Sophie von Stumm. 2018. “The New Genetics of Intelligence.” Nature Reviews Genetics 19:148–159.
- Feldman, Marcus W., and Sohini Ramachandran. 2024. “Heritability Within Groups Is Uninformative About Differences Among Groups.” PNAS.
- Winther, Rasmus Grønfeldt, et al. 2022. “The Background and Legacy of Lewontin’s Apportionment of Human Genetic Diversity.” Philosophical Transactions of the Royal Society B.
- National Academies of Sciences, Engineering, and Medicine. 2023. Using Population Descriptors in Genetics and Genomics Research.
- Howes, Rosalind E., et al. 2011. “The Global Distribution of the Duffy Blood Group.” Nature Communications 2:266.
- González, L. et al. 2023. “Relationship between Duffy Genotype/Phenotype and Prevalence of Plasmodium vivax Infection: A Systematic Review.”
- Yang, Jian, et al. 2017. “Genetic Signatures of High-Altitude Adaptation in Tibetans.” PNAS.
- Yoshiura, Koh-ichiro, et al. 2006. “A SNP in the ABCC11 Gene Is the Determinant of Human Earwax Type.” Nature Genetics 38:324–330.
- Strenze, Tarmo. 2007. “Intelligence and Socioeconomic Success: A Meta-Analytic Review of Longitudinal Research.” Intelligence 35:401–426.
- Richerson, Peter J., Robert Boyd, and Joseph Henrich. 2010. “Gene-Culture Coevolution in the Age of Genomics.” PNAS 107:8985–8992.
- Sear, Rebecca. 2022. “Demography and the Rise, Apparent Fall, and Resurgence of Eugenics.” Population Studies 76:S201–S220.
- European Human Behaviour and Evolution Association. “EHBEA’s History.” Records its 2020 national-IQ-dataset statement.
- Rushton, J. Philippe, and Arthur R. Jensen. 2005. “Thirty Years of Research on Race Differences in Cognitive Ability.” Included as a provenance source for circulation of the MTRAS table, not as neutral scientific authority.
Full transcript
Full transcript (YouTube automatic captions; lightly normalized)
Automatic captions can mishear names, numbers, and punctuation. The wording below is retained as evidence of what the video appears to say, not as authentication of every proper noun or statistic.
0:00 — The West is racist. That’s what mainstream leftism has been saying for decades. Why else would there be such great disparities in income, crime rates, etc. between racial groups? In their worldview, all racial groups and cultures are equal. Therefore, all disparities can only be explained by discrimination. And for just as long, the mainstream right has been counter-arguing that culture explains all disparities. In their worldview, some racial groups completely randomly adopted cultures that sabotage themselves. For them, culture is the root cause. Any racial group could theoretically adopt a culture that has worked for any other group and improve themselves. And for that reason, all could theoretically assimilate anywhere. Both of these worldviews are nonsensical. Obviously, discrimination isn’t the only factor, and culture clearly matters. But just as obvious, a people’s culture is not random. It’s the product of the people who create and sustain it. And isn’t there a more
1:00 — obvious root cause to consider? That perhaps different groups are innately different and foster different outcomes even in the absence of outside forces. When studying group disparities, why don’t we examine the groups themselves? You already know why. Because in our modern society, one of the most sacred dogmas is racial egalitarianism. The belief that all racial groups are fundamentally the same. Which is precisely why in this video, I’ll be ranking and debunking all arguments for racial egalitarianism and then putting them on a tier list. If you enjoyed, consider subscribing. It helps the channel. A quick disclaimer. Since this entire debate exists because of the collective disparities between entire groups, we’ll therefore be dealing with collective group averages. Therefore, the existence of exceptional individuals of any group isn’t relevant as they are precisely that, exceptions. If you’re the kind of person who accuses other groups collectively when it suits you, but then accuse others of racism if they don’t treat members of your group as individuals, you can click off.
2:02 — Intelligence is not genetically linked. This obviously false statement is a necessary act of mental gymnastics for the purely socio-economic factors crowd. Because intelligence is heritable, as shown from twin and adoption studies, it’s completely within reason to say that certain groups have selected for it more than others. In fact, if you agree with evolution, then you must concede this. How else would humans have evolved intelligence? Some dog breeds are obviously smarter than other dog breeds. The Border Collie and Chihuahua are both the same species, yet differ greatly in intellect and trainability. Should we expect that Chihuahua would do as well as a Border Collie? Is it purely socio-economic factors and anti-Chihuahua racism that makes them a minority in working dog roles? NPC tier. Humans are genetically 99.9% identical. You share half of your genes with a banana. 90% of your DNA sequence is shared with your cat. Quantitative
3:03 — similarities between genetic content does not equal qualitative differences. That 0.1% matters. Did you know that gray wolves are 99.9% identical to domestic dogs? In fact, they only diverge from each other about 20 to 30,000 years ago, which is significantly shorter than the divergence between some human groups. But obviously, that doesn’t mean it’s okay to bring a gray wolf to the dog park. If gray wolves on average end up being more aggressive than dogs, solely blaming it on just socio-economic factors like dog trait disparities seems a little silly. Because remember, aggression, impulse control, personality traits are all also genetically linked. NPC tier. There is more intragroup variance than intergroup. This claim says that the genetic difference between one randomly selected person in the village and another randomly selected person in the same village is greater than the genetic difference between the average person of
4:04 — one race and the average person of another. Therefore, race is inconsequential. The premise is true, but there’s a flaw in this logic. Not all genes are made equal. Most random genetic variants between people doesn’t matter. But some specific genes matter so much that practically the entire group adapted to have those genes and are often defined by it. For example, the Duffy negative mutation, which is found in 95 to 100% of West and Central Africans, makes them immune to malaria. But 0% of those without African blood have it. Or the Tibetans EPAS1, which allows them to survive in high altitudes where oxygen is reduced by about 40%, which occurs for them about 90% of the time, but 0% for Africans and Europeans. Or the ABCC11 gene that makes 80 to 95% of East Asians have no sweat odor. But again, practically non-existent elsewhere. This becomes even more
5:04 — complex when it comes to traits that are influenced by multiple genes. We haven’t fully isolated the genes that are responsible for intelligence or personality, yet we do know both are genetically linked. And I think we can both agree that social cohesion caused by similarities in intellect and character is vastly more important to survival than odorless sweat. Flaw two. Race is a social construct. Nowadays, whenever a leftist says X is a social construct, you should just interpret that as code for I have no counter to this observable aspect of reality. It’s not an argument, it’s just wordplay. What does social construct even mean anymore? Anything that humans have a socialized concept for? By that logic, everything is a social construct. The sun, the earth, molecules, everything has a socialized concept, as proven by the fact that I can name them and you know what I’m talking about. The fact that we have a social construct surrounding any aspect of reality does not mean that aspect of reality is made
6:04 — up. In fact, we build social constructs around real things out of necessity. Abestir. IQ tests are unreliable. For many decades, race egalitarian have had to deal with the world IQ map, which showed interesting patterns between IQ score and identity. Their only rebuttal has been either that IQ was not meaningfully influenced by genetics, which is demonstrably false, and that IQ has issues. I don’t contest the latter, but it’s the best we’ve got. IQ is the best predictor of success that we have, even more so than being born rich. Some then argue that IQ in reality should be used as a predictor of success in Western society, rather than intelligence. Find them. If IQ is a reliable metric for success in Western society, then naturally those of low IQ will not do well in Western society, and therefore we should not be importing them, nor should we expect low IQ groups to have similar outcomes to high IQ groups, even in the absence of discrimination. Since IQ is so
7:06 — artificially advantageous in the West, let those of low IQ thrive in other societies. Why do they insist on coming to our ones where they’ll suffer? The reason is because there are no societies where high IQ isn’t advantageous. MPC tier. Culture fully explains disparities. This is everyone’s favorite cope when they don’t agree that the West is discriminating against certain groups, but don’t want to give leftist reasons to call them racist. Here’s the thing, you’re going to be called racist regardless when you disagree, so you might as well be honest. Why do some groups adopt or create certain cultures more readily than others? Both genes and culture obviously have an effect on each other. Genetics influence on what culture you’re most innately compatible with, and culture works as a form of selection. But which came first, genetics or culture? This isn’t a philosophical question. Genes obviously predate culture. Culture is a product of a people, not the cause of it, even if
8:07 — there is a feedback loop. Just because a culture works for one group of people doesn’t mean it works for all. Abysstier. Different groups are different for a reason. They adapted to survive in their own unique circumstances. The expectation that you can transplant a people from one part of the world into another, and that they’ll integrate and perform at identical levels to anyone else, is a delusion rooted in the routinely debunked blank slate ideology. An ideology perpetuated solely by the fear of being labeled racist. That concludes the tier list. If there are any other arguments you’d like to see addressed, please share them in the comments below.