Project context
- Video: Why Is Black America Like That?
- Transcript source: YouTube automatic English captions, retrieved 2026-09-02
- Research status: Full transcript, screenshot audit, official historical-series reconstruction, causal-literature review, and source-provenance analysis completed 2026-09-02.
- Overall verdict: Mostly misleading. Several underlying disparities are real, but the video changes definitions, supplies a false pre–civil-rights two-parent statistic, generalizes homicide data to “crime,” and does not establish its single-cause welfare explanation.
Executive verdict
The video begins with genuine subjects for serious inquiry: Black Americans experience a much higher homicide-victimization rate than White Americans; nonmarital births increased substantially during the twentieth century; the share of Black children living with two parents declined; family instability is associated with adverse outcomes; and some means-tested benefit rules can create marriage penalties.
It does not follow that the video’s causal and moral story is correct. The presentation repeatedly changes the measured population or outcome without warning:
- homicide victimization becomes offending;
- a homicide-offender share becomes “more than half the crime”;
- an undefined high-risk subgroup becomes a claim that one in twenty commits murder;
- birth to an unmarried mother becomes father absence;
- one-parent residence is treated as the exact complement of two-parent residence;
- time trends after 1964 become proof that civil-rights-era welfare caused them; and
- aggregate trends become a verdict on “the character” of Black America.
The strongest directly falsified point is the claim that about 78% of Black children lived with two parents before civil rights. The Census Bureau’s historical table reports about 67.0% in 1960, not 78%. The widely circulated 78% appears to be derived by subtracting a roughly 22% one-parent figure from 100 while overlooking that about 11% of Black children lived with neither parent. The video’s modern figure—about 44%—is close to the Census estimate for Black-alone children in 2023.
The timing also contradicts “all reversals started” with the Great Society. The Department of Labor’s historical compilation reports nonmarital births among non-White mothers rising from 16.8% in 1940 to 23.6% in 1963, before the 1964–65 programs blamed by the video. Census data show only 67.0% of Black children living with two parents in 1960 and 58.7% in 1968. Welfare incentives may be one contributing mechanism, but modern causal research does not support treating them as the sole or dominant explanation for the whole trend.
Debate-safe conclusion
The defensible position is not “there is no disparity” and not “welfare destroyed Black character.” It is that homicide exposure and family instability are serious, unevenly distributed problems whose causes must be evaluated with consistent measures and multi-causal evidence. Descriptive trends do not identify a policy discontinuity, and population averages do not justify a collective moral verdict.
Claim ledger
| Timestamp | Claim | Finding | Verdict |
|---|---|---|---|
| 0:00 | Black America is characterized by disregard for order, extreme crime, fatherlessness, and self-sabotage. | Some measured disparities are real; the sweeping characterization turns selected outcomes into a racial moral essence and ignores within-group variation. | Overgeneralized value judgment |
| 0:17 | Academics blame every disparity on racism as an unfalsifiable excuse. | Academic work tests many mechanisms—labor markets, segregation, neighborhood conditions, policing, incarceration, family structure, education, and policy. Some uses of “systemic racism” can be vague, but the universal claim is a straw man. | Unsupported generalization |
| 0:46 | Black male homicide victimization was about 42 per 100,000 around 1960. | CDC historical tables report 1960 Black-male homicide rates of about 44.9 age-adjusted and 36.6 crude per 100,000. 42 is plausible under another construction or rounding, but the video does not specify which series it uses. | Approximately plausible; undefined |
| 0:55 | The rate reached 78 per 100,000 by 1970, nearly doubling after civil rights. | CDC reports about 82.1 age-adjusted and 67.5 crude in 1970. A sharp 1960s rise is real. Calling the endpoints “pre-1960s” and “after civil rights” encourages a causal reading that two points do not establish. | Trend real; causal framing unsupported |
| 1:04 | “Today” the Black-male homicide-victimization rate is about 50 per 100,000. | CDC’s 50-jurisdiction violent-death system estimated 56.0 for Black males in 2022; BJS estimated 21.3 for Black persons of both sexes in 2023. About 50 is plausible for a recent male-specific estimate, but “today,” race/ethnicity category, data system, and age adjustment are unspecified. | Plausible but inadequately sourced |
| 1:10 | Victimization is a proxy for offending because about 90% of homicide is intraracial. | Same-race victim/offender pairings are common in known single-victim/single-offender cases. Yet victims are not offenders; unsolved cases, missing race, multiple offenders/victims, age distributions, and interracial cases prevent direct substitution. | Rough ecological proxy, not an offending rate |
| 1:17 | The rest of the world has undergone a massive decline in crime. | Global homicide rates have declined in broad recent aggregates, but trajectories vary by region and period, and “crime” is much broader than homicide. | Overbroad |
| 1:25 | Black people are 13% of the population and commit more than half of crime. | The familiar figure concerns homicide offenders of known race in selected FBI supplemental data, not all crime. In FBI 2019 NIBRS data, Black persons were about 1.93 million of 6.54 million known/unknown-race offenders across recorded offenses, not more than half. Arrests or recorded offenders are also not unique persons proven to have committed offenses. | False as stated |
| 1:36 | The high rate is specifically young Black males. | Homicide offending and victimization are heavily concentrated by age and sex, so subgroup concentration is real. The video supplies no defined age band, rate, cohort, or table. | Directionally true; unspecified |
| 1:48 | Some controlled estimates show that 1 in 100 to 1 in 20 members of certain Black-male groups commit murder. | No citation, population, time horizon, numerator, or model is given. Annual offenders, lifetime unique-person probability, and a subgroup’s estimated risk are different quantities. Recidivism, unknown offenders, age-specific hazards, cohort change, and competing mortality prevent the claimed conversion. | Unsupported |
| 2:03 | Because most Black homicide victims are killed by Black offenders, Black Lives Matter is a joke and police were not the relevant audience. | Intraracial homicide and police use of force answer different questions. State agents have distinctive legal powers and duties; concern about one does not logically exclude concern about the other. | Non sequitur / normative rhetoric |
| 2:20 | Fatherlessness has a clear causal link with criminality. | Family disruption is associated with delinquency and other adverse outcomes. Reviews using stronger causal methods generally find smaller effects than raw comparisons and substantial variation by outcome and design. “Fatherlessness” also conflates death, divorce, nonmarital birth, incarceration, nonresidence, and low involvement. | Association well-supported; simple causal claim overstated |
| 2:31 | Only 15–19% of Black children were born to unmarried mothers in the 1940s. | The Department of Labor historical series gives 16.8% of non-White births in 1940. It reached 23.6% by 1963, so the low figure is not the immediate pre–civil-rights baseline. | Accurate for 1940; cherry-picked baseline |
| 2:43 | Today 70–78% are born to unmarried mothers. | CDC’s 2023 final birth tables report about 69.3% for non-Hispanic Black births. “Birth to an unmarried mother” does not necessarily mean no father is present or involved. | Near the low end historically; category mislabelled |
| 2:51 | About 78% of Black children lived with two parents before civil rights. | Census historical data give about 67.0% in 1960. The 78% claim appears to ignore the approximately 11% living with neither parent. | False |
| 2:56 | Less than half live with two parents today, about 44%. | Census 2023 reports approximately 44.6% of Black-alone children living with two parents (about 46.1% for Black alone or in combination). | Substantially correct |
| 3:06 | After civil rights, Democrats sought Black votes through the War on Poverty. | Electoral incentives existed, but the War on Poverty had multiple stated aims and beneficiaries. AFDC originated in 1935, was renamed in 1962, and was not created as a post–Civil Rights Act program. | Partly chronological; reductive motive claim |
| 3:29 | Welfare eligibility was largely conditional on a father’s absence. | AFDC historically focused on “dependent children” deprived of support through death, incapacity, or absence. Two-able-bodied-parent eligibility was restricted and varied; the 1961 AFDC-UP option and later changes complicate the blanket claim. | Real institutional feature, oversimplified |
| 3:38 | Single mothers could receive benefits exceeding a low-income worker’s earnings. | Benefit packages, taxes, household size, state, year, and earnings matter. Some benefit phase-outs create marriage penalties, but the video provides no historical package or comparison. | Possible in some cases; unsubstantiated here |
| 3:46 | Government directly incentivized Black women to divorce and “marry the state.” | Program rules could reduce the financial gain from marriage. Evidence on actual marriage and family-structure effects is mixed and generally does not support welfare as a complete explanation. The incentives were means-tested, not racially exclusive. | Mechanism plausible; causal magnitude overstated |
| 3:53 | All reversals of Black progress began during this period. | Nonmarital births were already rising before 1964, and the 1960 two-parent share was already far below the alleged 78%. Homicide rose broadly during the 1960s, but no single policy discontinuity is demonstrated. | False |
| 4:02 | The welfare state framed spending as the “White man’s burden.” | This is an ideological interpretation, not a documented summary of statutory purpose or legislative evidence. | Unsupported framing |
| 4:17 | Removing fathers caused a permanent underclass. | Family structure is one plausible pathway, but employment, wages, deindustrialization, housing segregation, schooling, incarceration, violence exposure, sex ratios, policy, and cultural change are competing or interacting explanations. Permanence is contradicted by variation over time and place. | Single-cause overreach |
| 4:44 | The “content of modern Black America’s character is lacking.” | No operational definition or test could establish a collective character defect from aggregate outcomes. It is an ecological and moral generalization about tens of millions of people. | Not an empirical conclusion |
Reconstruction of the historical series
Homicide victimization
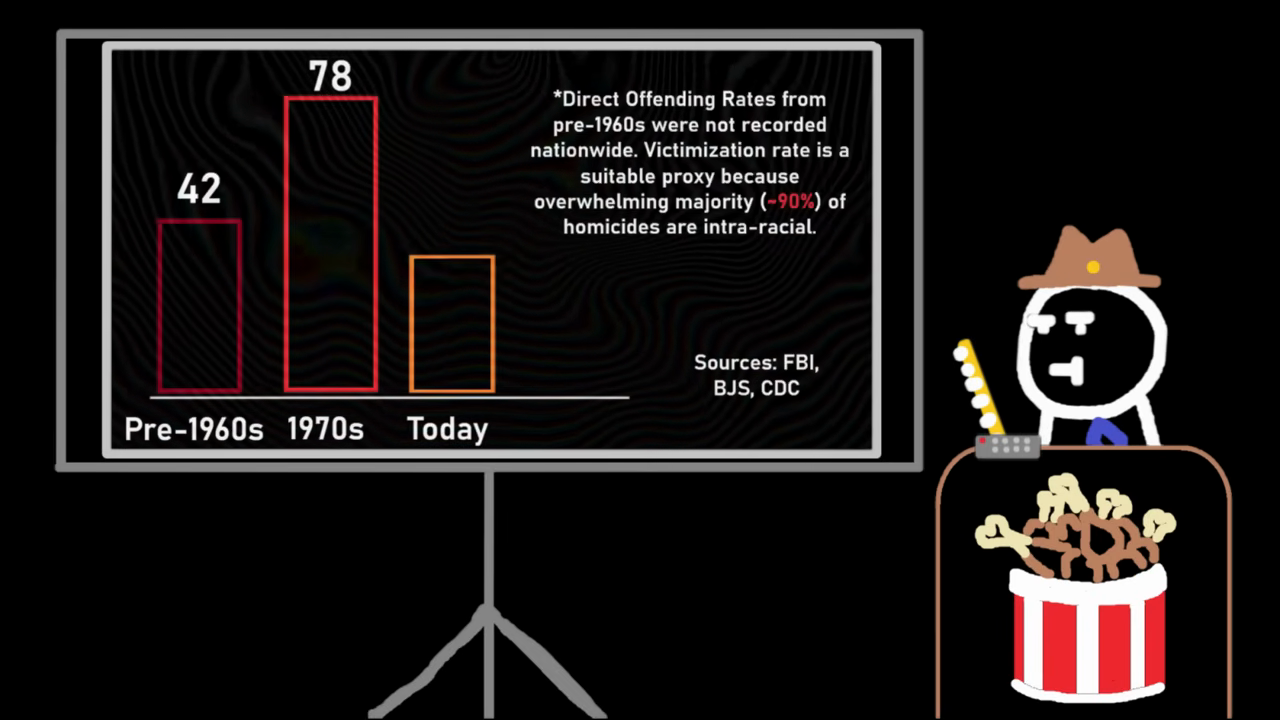
The frame cites only agencies—FBI, BJS, and CDC—not a table, extraction date, or definition. Official CDC historical mortality data support the direction of the 1960s increase but show why definitions matter:
| Measure | 1960 | 1970 | What it means |
|---|---|---|---|
| Black male, age-adjusted homicide death rate | 44.9 | 82.1 | Death-certificate rate standardized for age |
| Black male, crude homicide death rate | 36.6 | 67.5 | Deaths divided by the observed Black-male population |
| Video | ~42 | ~78 | Unspecified combination or rounding |
The video’s numbers sit between the official crude and age-adjusted values, but it does not identify a coherent series. A recent CDC violent-death surveillance estimate of 56.0 per 100,000 Black males in 2022 makes the “about 50 today” order of magnitude plausible, though it is not automatically comparable to a 1960 death-certificate series because race/ethnicity and surveillance methods changed.
Victimization can track some broad changes in offending because homicide often involves people of the same race and local social network. It remains a proxy. A victim count cannot be relabelled an offender count, and an offender’s race is unknown in many cases.
Nonmarital births
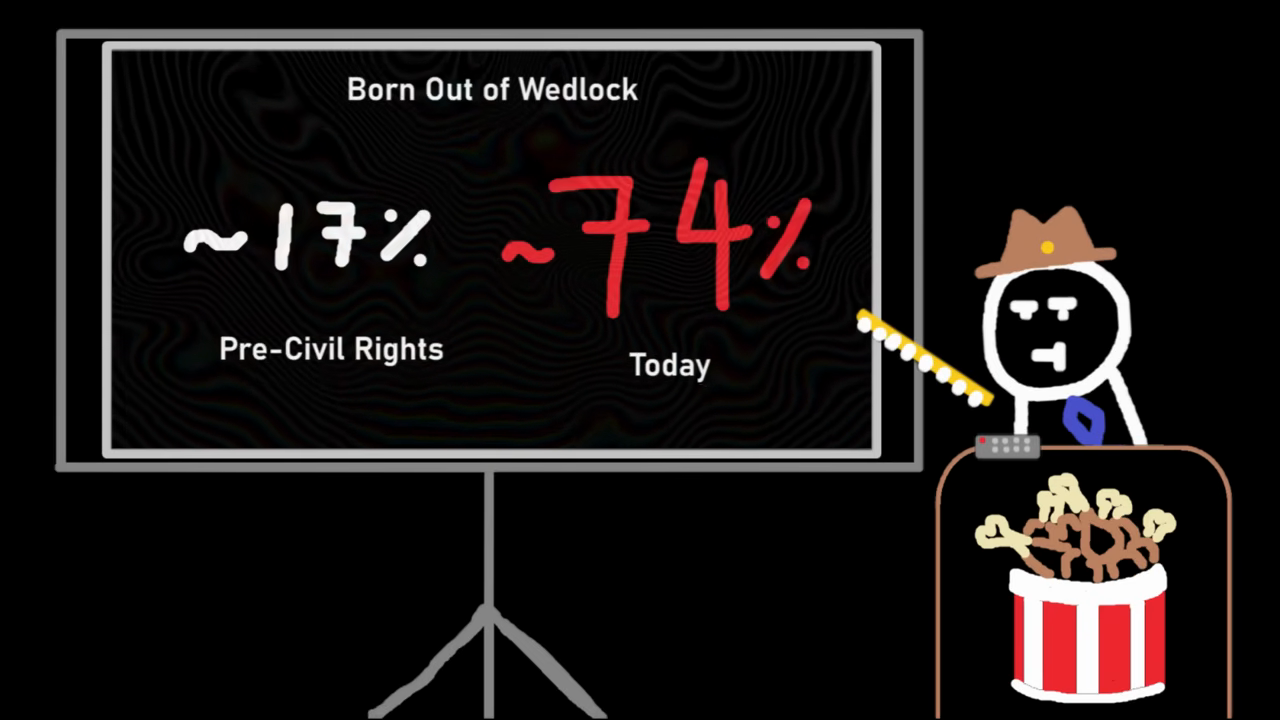
The slide’s endpoints conceal an important pre-policy trend:
| Year | Measure | Share |
|---|---|---|
| 1940 | Non-White births outside marriage, historical Department of Labor series | 16.8% |
| 1963 | Non-White births outside marriage | 23.6% |
| 2023 | Births to unmarried non-Hispanic Black mothers, CDC final data | ~69.3% |
The categories are not perfectly continuous across eight decades, but they are adequate to disprove the claim that the reversal began only after the mid-1960s. The outcome is marital status at birth—not direct observation of paternal residence, involvement, support, or later family structure.
Children living with two parents
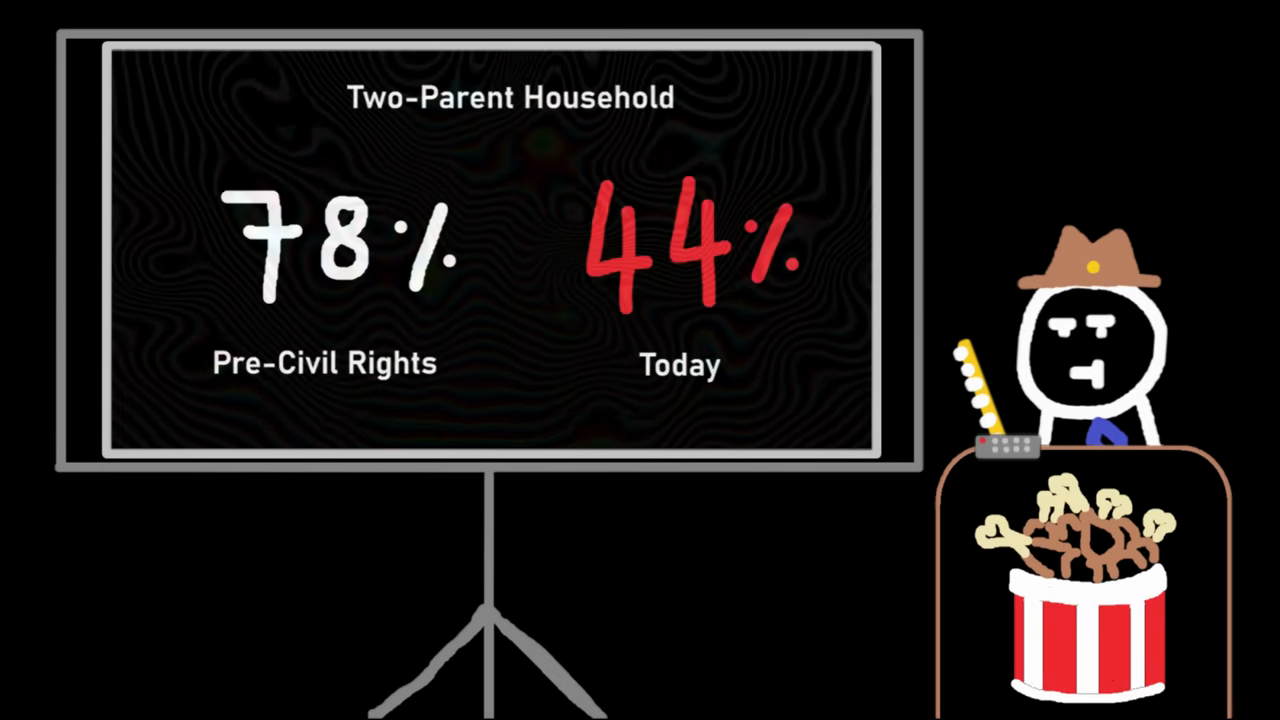
The Census Bureau workbook distinguishes children living with two parents, one parent, and no parent. Reconstructing the percentages from the official counts gives:
| Year/category | Total children (thousands) | Living with two parents (thousands) | Calculated share |
|---|---|---|---|
| 1960 Black/non-White historical category | 8,650 | 5,795 | 67.0% |
| 1968 Black | 9,714 | 5,702 | 58.7% |
| 1970 Black | 9,910 | 5,804 | 58.6% |
| 2023 Black alone | 11,227 | 5,005 | 44.6% |
| 2023 Black alone or in combination | — | — | 46.1% |
In 1960, about 1.897 million lived with one parent and about 958,000 lived with no parent. Therefore:
[
100%-21.9%\text{ (one parent)} \neq 78.1%\text{ (two parents)},
]
because roughly 11.1% were in the separate no-parent category. The actual two-parent result is about 67.0%. This is the most likely origin of the video’s erroneous 78%.
Welfare and the causal claim
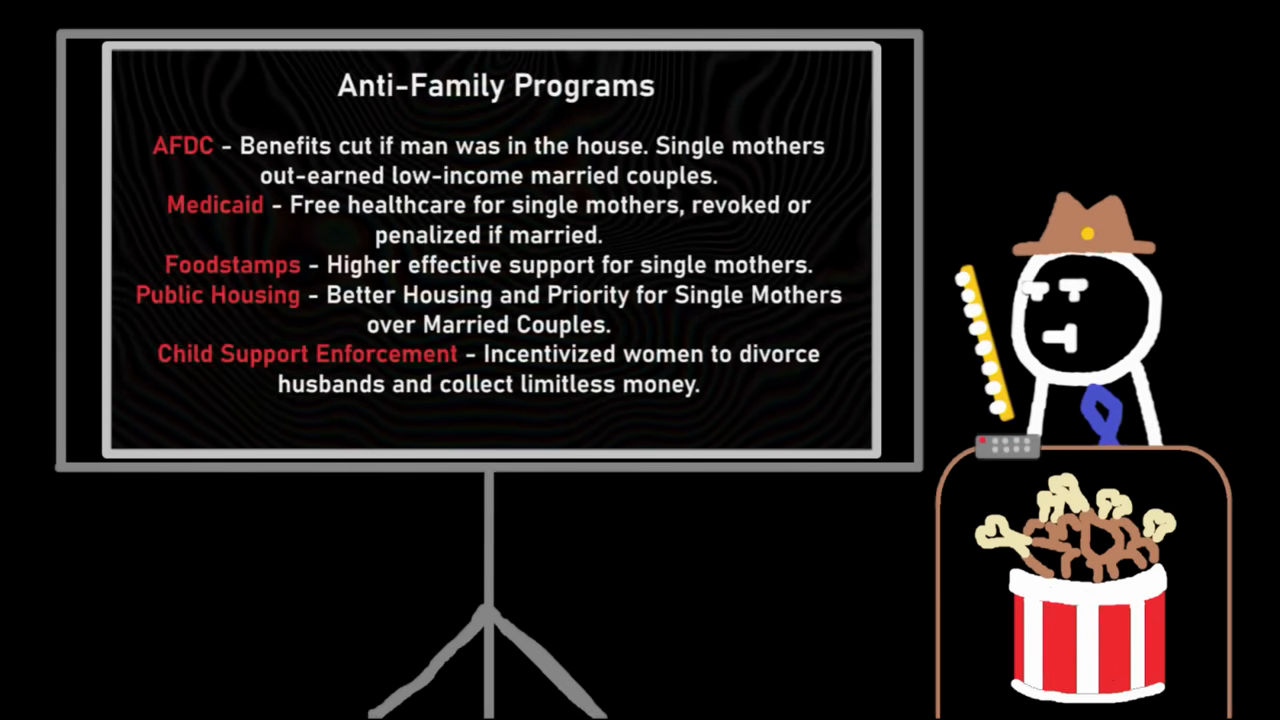
The slide labels AFDC, Medicaid, food stamps, public housing, and child-support enforcement “Anti-Family Programs.” It provides no dates, statutes, benefit schedules, or effect estimates. The careful assessment is:
- AFDC did contain family-status rules. Federal aid originally focused on children deprived of parental support; before the 1961 unemployed-parent option, many two-able-bodied-parent families were excluded. State implementation and “man-in-the-house” rules could penalize co-residence or marriage.
- The rules were neither static nor identical. In King v. Smith (1968), the Supreme Court struck down Alabama’s “substitute father” rule as inconsistent with federal law. AFDC-UP rules, state choices, and later federal reforms changed eligibility.
- Means-tested programs can create marriage penalties. Combining two adults’ income can reduce benefits. The size and behavioral effect depend on program, state, year, household composition, and labor income.
- A plausible incentive is not a demonstrated historical cause. Reviews of welfare and family structure find mixed and generally modest effects; the evidence does not account for the full long-run rise in nonmarital childbearing or female-headed households.
- The list confuses different mechanisms. Child-support enforcement generally attempts to recover support from noncustodial parents; calling it an unlimited incentive to divorce requires evidence the video does not provide.
The causal story also needs comparison against alternatives and interactions: Black male employment and earnings, deindustrialization, migration, residential segregation, incarceration, violent mortality, sex ratios, educational change, contraception, shifting marriage norms, and the changing returns to marriage.
Source-provenance findings
Thomas Sowell is an explicit source lineage
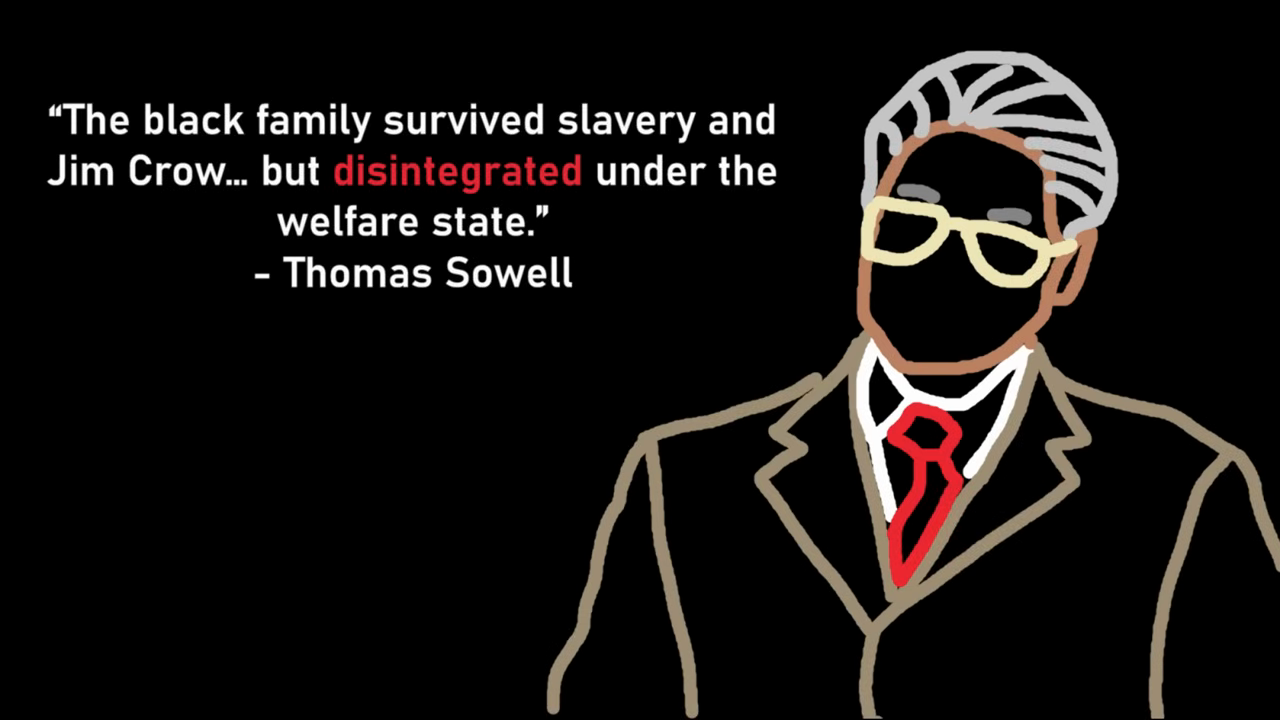
The final frame attributes this summary to Thomas Sowell: “The black family survived slavery and Jim Crow … but disintegrated under the welfare state.” Regardless of whether this exact sentence is a verbatim passage or a popular condensation, the video explicitly anchors its closing causal interpretation in Sowell’s welfare-state thesis. That is firmer evidence than thematic similarity alone.
The alleged Lyndon Johnson quotation
An earlier frame displays the notorious statement attributed to Johnson about keeping Black voters Democratic for 200 years, while conceding in small text that authenticity is “debated.” No contemporaneous recording, transcript, diary entry, or reliable firsthand documentation is supplied. It should be treated as unverified/apocryphal, not evidence of presidential intent.
Likely citation ecosystem
The video’s statistics and argument appear to combine several circulating sources rather than one documented research chain:
- FBI/BJS homicide-share memes and known-offender tables;
- popular “13/50” and “one in twenty” discourse;
- the
22% single-parent → 78% two-parentarithmetic shortcut; - Thomas Sowell’s welfare-and-family argument;
- the apocryphal Johnson quotation; and
- contemporary charts from advocacy/secondary sites, including a BlackDemographics.com family-arrangement graphic visible in the final collage.
This overlaps the possible-source network documented in Basic Logic Youtube Channel Research, but resemblance is not proof that any particular webpage or person supplied the script.
Methodological errors
- Outcome switching: victimization → offending → “crime” → character.
- Base-rate and time-horizon ambiguity: “one in twenty” is meaningless without an annual/lifetime horizon and a defined subgroup.
- Complement error: one-parent and two-parent are not exhaustive when a no-parent category exists.
- Cherry-picked baseline: 1940 is used as “pre–civil rights” while the 1963 value and pre-1964 trend are omitted.
- Post hoc causal inference: a change after civil rights or welfare expansion is treated as caused by it without a counterfactual.
- Single-cause history: one policy mechanism substitutes for a multivariable account of family, labor-market, neighborhood, criminal-justice, and cultural change.
- Ecological fallacy: group averages become a judgment about an individual Black person’s propensity or moral character.
- Category conflation: unmarried birth, absent father, nonresident father, uninvolved father, and one-parent household are treated as synonyms.
- Institutional non sequitur: intraracial private homicide is offered as an answer to allegations about government use of force.
- Racialized policy attribution: national means-tested programs are presented as a direct scheme targeting Black women without comparative evidence.
Cross-video connections
- Why Is Per Capita Impossible For Them supplies the channel’s denominator rhetoric and the same mislabelled
56%homicide-offender share. - The Genetics Behind Unequal Societies supplies a complementary hereditarian story: ancestry → neurology → psychology → civilization. This video instead uses family decline and welfare → criminality → collective character. The two mechanisms differ but converge on an essentialized group conclusion.
- Basic Logic Cross-Video Claim Map records the repeated escalation from a real descriptive disparity to a monocausal explanation and then a civilizational or moral judgment.
Open questions
- Which exact table or secondary post produced the video’s
42,78, and50homicide series? - What is the defined subgroup, time horizon, and model behind “1 in 100 to 1 in 20”?
- Was the 78% two-parent claim copied directly from a Sowell passage, a graphic, or another secondary source?
- Which benefit schedule supports the claim that a single mother received more than a low-income worker, and for what state, year, and family size?
- Does the channel use the same crime-and-family source bundle in other videos, especially Why Is Black America So Racist?
- Can the exact Sowell wording be located in a primary book, column, speech, or transcript, rather than only in circulating quotation graphics?
Primary and research sources
- CDC/NCHS, Health, United States, 1981 — historical crude and age-adjusted homicide mortality by race and sex.
- — recent Black-male homicide rate and surveillance definitions.
- Bureau of Justice Statistics, Homicide Victimization in the United States, 2023 — current national homicide-victimization rates and NIBRS/SHR methods.
- FBI, Crime in the United States, 2019: Expanded Homicide Data — known-race offender share and missing-data limitations.
- FBI, 2019 NIBRS: Offenders, Race by Offense Category — all-offense comparison showing why a homicide share is not “half of crime.”
- U.S. Department of Labor, The Negro Family: The Case for National Action, chapter II — historical nonmarital-birth series, including 1940 and 1963.
- CDC/NCHS, Births: Final Data for 2023 — current marital-status-at-birth data.
- U.S. Census Bureau, Historical Living Arrangements of Children and Table CH-3 workbook — two-parent, one-parent, and no-parent counts.
- Sara McLanahan, Laura Tach, and Daniel Schneider, “The Causal Effects of Father Absence,” Annual Review of Sociology 39 (2013) — review distinguishing associations from stronger causal evidence.
- Robert Moffitt, “The Effect of Welfare on Marriage and Fertility,” NBER Working Paper 8749 — review of welfare/family-structure evidence.
- Robert Moffitt et al., “The Effect of Means-Tested Transfers on Work and Marriage,” NBER Working Paper 21257 — modern policy-evidence review.
- Congressional Research Service, The Aid to Families with Dependent Children (AFDC) Program — program history and two-parent eligibility changes.
- U.S. Supreme Court, King v. Smith, 392 U.S. 309 (1968) — legal treatment of Alabama’s “substitute father” rule.
Full transcript
Full transcript (YouTube automatic captions; lightly normalized)
Automatic captions can mishear names, numbers, and punctuation. The wording below is retained as evidence of what the video appears to say, not as authentication of every proper noun or statistic.
0:00 — Let’s not beat around the bush. You’ve seen the clips. You’ve seen the statistics. The wanton disregard for public order, the absurd crime rates, fatherlessness, and the constant acts of self-sabotage. So, why is black America like that? Academics love to blame racism for any disparity between groups. It’s their default excuse, designed to be an unfalsifiable, all-explaining ghost. So, let’s put it to the test because in this video, I’m not comparing black Americans to other racial groups. Instead, I’m comparing the character of modern black America to pre-civil rights black America. A people which we can all agree suffered vastly more discrimination than modern blacks. Let’s start with the most obvious, crime. Around 1960, black male homicide victimization, which works as a proxy for offending rates, was already at a staggering 42 per 100,000. By 1970,
1:00 — after civil rights, that rate nearly doubled to 78 per 100,000. And today, it rests at about 50 per 100,000. Still an increase from pre-civil rights time. Despite the rest of the world going on a massive trend of decreasing crime rates. You might have heard the statistic that black people, being only 13% of population, commit more than half the crime. But it is actually worse than that. Because it’s not black people who are committing more than half the crime, but rather a specific subsection of them. Black grandmas aren’t going around robbing stores at gunpoint. It’s specifically young black males. And when we further control for variables, we start reaching population groups which we can almost guarantee are committing crime. This has pushed some estimates for murder rates among certain black male groups to be between 1 in 100 to 1 in 20. A rate of murder so unbelievably high, it makes the entire Black Lives
2:01 — Matter movement look like a joke. With about 90% of those murder rates of victimizing other blacks, it was never racist white cops that needed to hear about Black Lives Mattering, but rather the black youth. So, why are the black youth so out of control? The next statistic I want to bring up is fatherlessness, which has a clear causal link with criminality. Despite blacks in the 1940s literal segregation and vastly higher poverty rates, their families were much stronger. Back then, only 15 to 19% of black children were born to unmarried mothers. Today, that number is 70 to 78%. If you’d rather go by parental presence, today less than half of black children grow up in a two-parent household, as opposed to pre-civil rights at about 78% living with both parents. These are among the worst statistics for fatherlessness worldwide. But, why has the black family been so
3:01 — thoroughly eviscerated? After civil rights, Democrats strategy shifted to appeal to the expanding black voter base. And, what do statists usually do for votes? They promise free stuff. The war on poverty, as it was called, had begun through massive federal welfare. But, the welfare was conditional for those who quote “needed it” and determined largely by whether or not a father was present. If a father was not present, single mothers could be eligible for welfare that exceeded how much money a low-income worker would get. In other words, the government directly incentivized black women to divorce their husbands and marry the state. The policy outcomes cannot be denied. All reversals of black America’s progress started during this period. The state, of course, had to justify the cost of this massive welfare scheme to the rest of the American population, claiming that it was the white man’s burden. Historical injustice had created this
4:02 — poverty, and so it was white people’s jobs to fix it. Since the black fathers were now removed from the picture, black families lost their own protectors and providers. And so, this became a permanent situation. Should we be surprised that young black men who grew up without a father live in a society that sabotaged the main source of commitment in a man’s life, marriage, and are taught not to take responsibility for their own lives, and that all their problems are white people’s fault, that they would become disenfranchised and delinquent? Therefore, what we’re left with today is a perpetual underclass, which abandoned their families, murdered their own brothers, and forsake the rule of law. Kept financially afloat by guilt-tripping the same people they blame for all their problems. All our lives we were taught to judge by the content of one’s character, and the content of modern black America’s character is lacking. They can now serve only as an example for all other groups that wish to be the
5:02 — best version of themselves on what not to do.