Filicide means a parent or parent figure killing a child. It is an offense category, not a diagnosis or a single motive. Population studies, psychiatric case series, forensic-hospital samples, and famous trials observe different slices of the phenomenon; their percentages are not interchangeable.
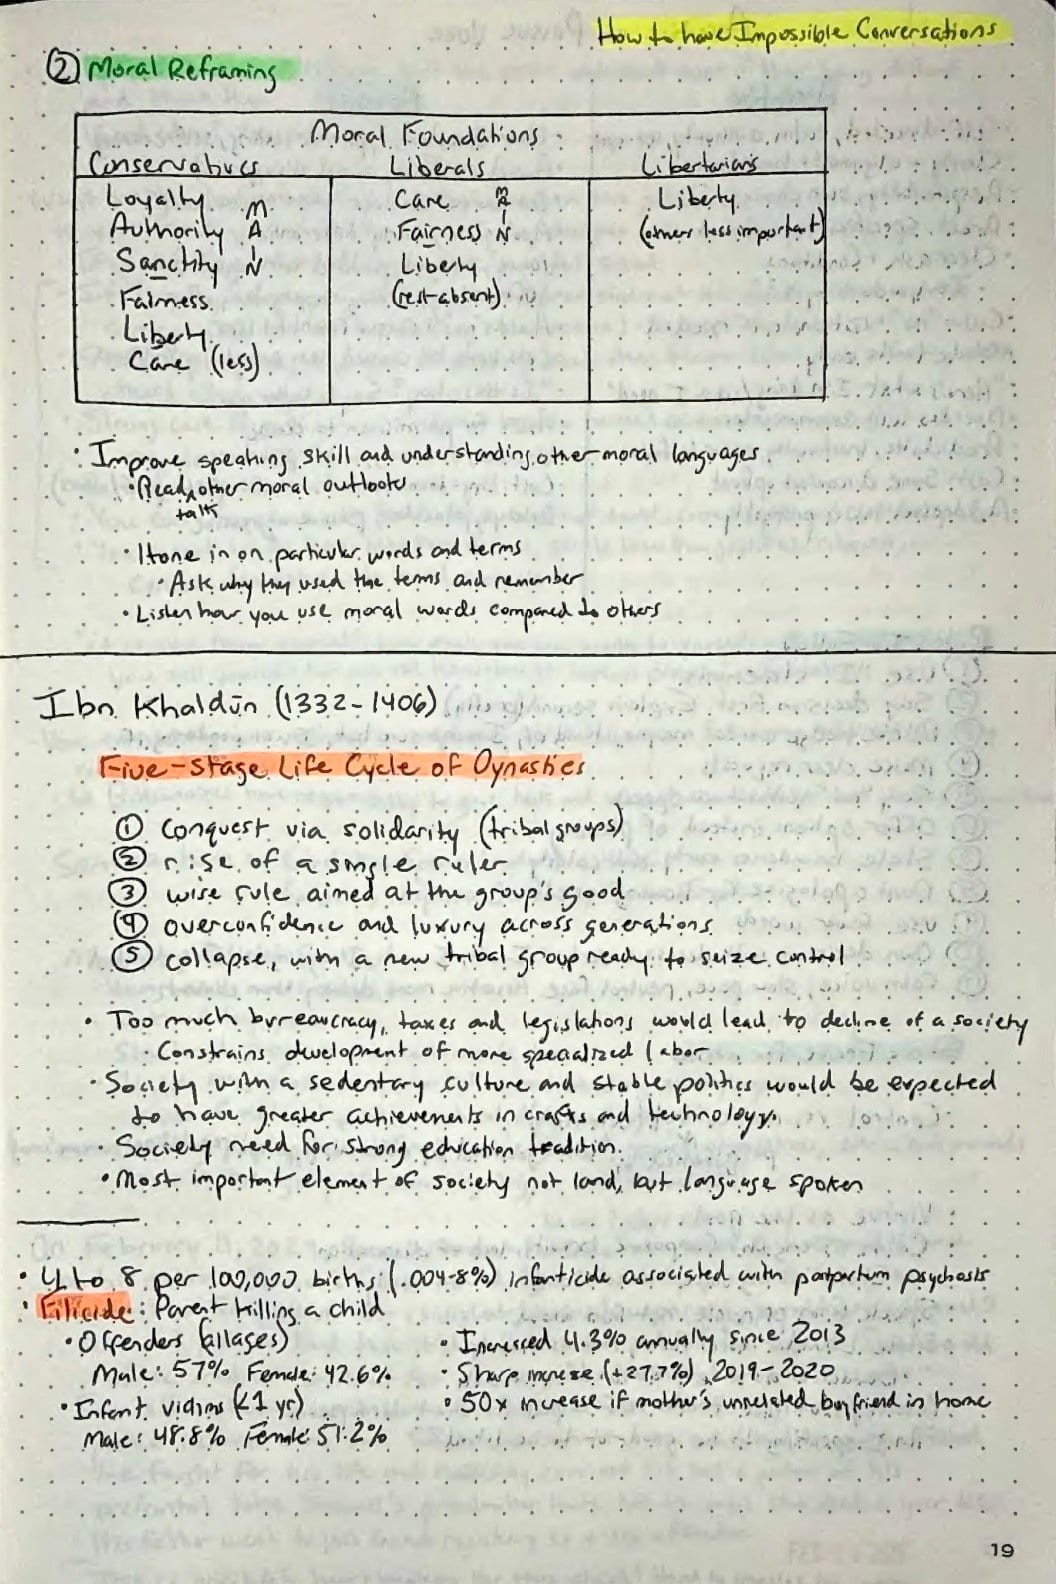
Pinker’s Chapter 7 supplement — infanticide across unlike evidence bases
Pinker reports anthropological and historical estimates in which infanticide was accepted in 77% of sampled nonstate societies and may once have killed 10–15% of newborns, with higher estimates in some societies. In Martin Daly and Margo Wilson’s coding of 112 recorded reasons across sixty societies, 87% fit a “triage” account: illness or deformity, disputed paternity, absent support, older nursing siblings, famine, or other conditions that lowered a newborn’s prospects. Explanation is not exoneration, and ethnographic acceptance is not the same denominator as a modern homicide rate.
Pinker contrasts those estimates with 221 murdered U.S. infants among 4.3 million births in 2007, from which he infers a two- to three-thousandfold historical reduction. The comparison is directionally striking but not measurement-equivalent: the ancient figures are reconstructed estimates, the modern figure is a recorded count, and infanticide is only one age-defined subset of filicide. His account also distinguishes concealed-birth neonaticide, fatal abuse, filicide-suicide, and postpartum psychosis—categories that should not be treated as one motive. His presentation of Edward Hagen’s idea that postpartum depression functions as an evolved “evaluation period” is a disputed adaptationist hypothesis, not clinical guidance or an established explanation of the disorder.
Female infanticide and sex-selective abortion receive a separate analysis. Pinker links son preference to patrilocality, inheritance, dowry, old-age support, war, and policy-created incentives; he does not demonstrate one universal cause. The reusable lesson is methodological: age, relationship, motive, legal category, sex selection, and data source must remain separate before rates or perpetrator profiles are compared. Chapter 7 synthesis · Historical prevalence claims, PDF pp. 577–580 (file not included in this release) · Triage evidence and its interpretation, PDF pp. 580–582 (file not included in this release) · Sex selection and incentives, PDF pp. 582–587 (file not included in this release) · Modern U.S. infant homicide, PDF pp. 587–588 (file not included in this release)
Evidence snapshot
- In a 32-year U.S. arrest study, fathers or father figures accounted for 57.4% of alleged filicide offenders and mothers or mother figures for 42.6%.
- Parent sex varies with victim age: mothers and fathers were approximately equally represented among infant victims, while fathers increasingly predominated as children became older.
- There is no defensible national U.S. statistic for the share of filicidal mothers versus fathers found not guilty by reason of insanity. Arrest databases do not follow cases through psychiatric evaluation, plea, verdict, and disposition.
- International legal-outcome figures vary sharply because laws, samples, victim ages, suicide rates, and clinical profiles differ.
- There is likewise no national filicide-specific average for hospitalization after an insanity acquittal. A recent one-state study of released insanity acquittees charged with homicide found a mean stay of 8.1 years, which is a broad homicide proxy—not a prediction for any individual case.
Definitions and denominator rules
- Filicide: killing of a child by a parent or parent figure. Studies differ on whether stepparents, adoptive parents, foster parents, or intimate partners are included.
- Infanticide: commonly the killing of an infant under one year, although legal definitions vary by country.
- Neonaticide: killing within the first 24 hours of life. Concealed-pregnancy and birth circumstances make this population markedly different from later-child filicide.
- Filicide-suicide: the parent dies by suicide after killing the child. Such perpetrators disappear from trial and verdict samples.
- NGRI/NCR: not guilty by reason of insanity/not criminally responsible. This is a legal finding about responsibility at the time of the offense, not simply the presence of mental illness.
- Unfit/incompetent to stand trial: a present inability to understand proceedings or assist counsel. It is legally distinct from insanity at the time of the act.
- Hospital disposition: commitment to a psychiatric institution. It is not synonymous with an insanity verdict; some systems permit hospital orders after other adjudications.
Three recurring denominator errors
- A sample of people already admitted to a forensic hospital cannot reveal the insanity-defense success rate among all defendants.
- A maternal sample concentrated in neonaticide and infant deaths cannot be compared uncritically with a paternal sample containing more older-child deaths.
- A verdict study that excludes completed filicide-suicides can undercount fathers, who are often overrepresented among perpetrators who also die.
England and Wales: historical infant homicide and parental filicide
Bottom line
The assembled evidence is consistent with a large long-run decline in lethal violence against infants and in recorded killings of children by parents. It is not one continuous measurement series. Before modern vital registration and the Home Office Homicide Index, the evidence consists of surviving court records, coroners’ verdicts, historical samples, and reconstructed denominators. The first chart therefore preserves the observations from the research conversation while marking estimates and period midpoints; the line between them is only a visual guide. The second chart is much more coherent, but it still mixes calendar and financial years, changing relationship labels, and revision vintages.
What the terms and measures mean
| Term | Meaning in this note | Do not confuse it with |
|---|---|---|
| Filicide | A parent or parent figure kills a son or daughter; a study may include biological, adoptive, step-, foster, or de facto parents. | All child homicide, because the killer may be a stranger, acquaintance, sibling, or unidentified person. |
| Infanticide | In descriptive historical and criminological writing, killing a child under one year. In England and Wales, infanticide is also a specific statutory offense: a mother causes the death of her child under twelve months while the balance of her mind is disturbed by childbirth or lactation. | A stable cross-period legal category. Older writers used the word more broadly, and many infant homicides are prosecuted or recorded as murder or manslaughter. |
| Neonaticide | Killing within the first 24 hours after birth, commonly associated in the literature with concealed pregnancy and birth. | All infant homicide or all maternal filicide. |
| Child homicide | A homicide victim below a specified age, regardless of the perpetrator’s relationship. The Home Office Homicide Index includes completed murder, manslaughter, and infanticide. | Parent-killing-of-children counts. The all-child series below is limited to victims under 16 with a parent/step-parent relationship to the principal suspect. |
| Recorded cases | Events that reached the surviving court, coroner, police, or statistical record under the period’s rules. | The true incidence. Concealed bodies, deaths recorded as stillbirth, exposure, suffocation, neglect, ambiguous infant deaths, and missing records can all produce undercounting. |
| Reconstructed estimate | A rate calculated from historical samples, assumptions, or a separately reconstructed denominator. | An official contemporaneous rate or a directly observed population measure. |
| Official rate | A rate published by a statistical authority for a defined population, age group, period, and recording vintage. | A final, revision-free number or a rate comparable to unlike historical reconstructions. |
The legal definition is from section 1 of the Infanticide Act 1938. The criminological under-one and first-24-hours usages follow the modern filicide literature; both must be stated explicitly because authors sometimes use infanticide for neonaticide alone or for all child killing.
Infant homicide and infanticide evidence, c.1600–2025
| Plotted year | Source period | Value normalized to 100,000 | Evidence status | What the point represents |
|---|---|---|---|---|
| 1600 | c.1600 | 40.0 | Reconstructed high estimate | Wrightson estimated that about 2% of illegitimate births in his material ended in infanticide when illegitimacy was roughly 2–3% of births. The chart uses the lower-bound product, about 40 per 100,000 total births, not a directly counted national rate. |
| 1670 | 1650–1690 | 35.0 | Midpoint of estimated range | Roth’s synthesis of surviving indictment studies places the peak at roughly 30–40 per 100,000 births. The plotted 35 is the midpoint of that range, not a point estimate for 1670. By c.1800 the synthesized estimate was below 10 per 100,000. |
| 1839 | 1838–1840 | 5.2 | Recorded cases plus reconstructed denominator | Sauer reports 76 recorded murders of infants under one. Registered births were 463,787, 492,574, and 502,303, totaling 1,458,664; 76 / 1,458,664 × 100,000 = 5.21. The chart plots the period midpoint. |
| 1864 | 1864 | 27.4 | Recorded coroners’ verdict rate | Behlmer reports 203 coroners’ verdicts of willful murder for children under one, equal to 27.4 per 100,000. It captures bodies found, reported, investigated, and classified that way. |
| 1875 | 1863–1887 | 15.4 | Conversation reconstruction | 3,225 recorded victims under one—61% of recorded homicide victims in the cited historical table—divided by about 20.93 million registered births gives 15.4 per 100,000. The point is plotted at the period midpoint and is a calculation from cited counts, not a published official rate. |
| 1972.5 | 1957–1988 | 4.5 | Published period rate | Marks and Kumar report about 45 per million children under one; their detailed 1982–1988 review counted 214 victims, about 30 per year. The chart converts 45 per million to 4.5 per 100,000 and plots the midpoint of the longer reporting period. |
| 2002 | 2001/02 | 4.6 | Official recorded rate | Home Office: 46 homicides per million children under one, converted to 4.6 per 100,000. |
| 2024 | YE March 2024 | 2.08 | Official rate | ONS: 13 victims under one, 20.8 per million resident infants, converted to 2.08 per 100,000. |
| 2025 | YE March 2025 | 3.16 | Official, provisional rate | ONS: 19 victims under one, 31.6 per million resident infants, converted to 3.16 per 100,000. The release warns that the latest Homicide Index data can be revised. |
The medieval evidence should remain outside the plotted rate series. Sara Butler identified 131 child-murder cases involving 144 victims in surviving royal and ecclesiastical court records from the late thirteenth to the early sixteenth century. That is a sample of litigated and preserved cases, not a population numerator, and there is no compatible births denominator. Butler’s broader methodological conclusion is decisive: the fragmentary medieval record does not support a precise incidence rate.
The nineteenth-century rise from the low 1838–1840 recorded rate to the higher mid-Victorian observations should not be read as a clean behavioral spike. Civil registration began only in 1837; changing inquest practice, policing, forensic attention, newspaper attention, and classification increased the chance that a death was found and labeled homicide. At the same time, concealment, the difficulty of proving live birth, “overlaying” or suffocation, exposure, and bodies never recovered kept the recorded series below the unknowable true level.
Modern infant homicide remains predominantly familial, but that statement is about identified suspects rather than the sex of all perpetrators. A Home Office freedom-of-information extract analyzed in Bad parents? covered 143 infant homicides in the preceding decade: 88 identified suspects were male and 55 female; 85 of the 88 male suspects were fathers, and 43 of the 55 female suspects were mothers. It is a relationship profile, not an infant-homicide rate and not a measure of legal guilt in every case.
Children killed by a parent or step-parent, 1977–2025
| Period | Underlying annual counts: year (or financial year ending) and recorded victims under 16 |
|---|---|
| 1977–1989 | 1977: 55 · 1978: 63 · 1979: 64 · 1980: 40 · 1981: 54 · 1982: 58 · 1983: 53 · 1984: 62 · 1985: 72 · 1986: 36 · 1987: 55 · 1988: 76 · 1989: 44 |
| 1990–1999 | 1990: 49 · 1991: 63 · 1992: 51 · 1993: 49 · 1994: 53 · 1995: 52 · 1996: 58 · 1997: 50 · 1998: 44 · 1999: 54 |
| 2000–2009 | 2000: 48 · 2001: 75 · 2002: 40 · 2003: 51 · 2004: 35 · 2005: 31 · 2006: 25 · 2007: 38 · 2008: 41 · 2009: 29 |
| 2010–2019 | 2010: 39 · 2011: 36 · 2012: 28 · 2013: 40 · 2014: 23 · 2015: 31 · 2016: 22 · 2017: 29 · 2018: 17 · 2019: 21 |
| 2020–2025 | 2020: 12 · 2021: 25 · 2022: 14 · 2023: 17 · 2024: 19 · 2025: 14 |
The chart reproduces the conversation’s series snapshot. The 1977–1997 observations are calendar years; later observations are financial years plotted by ending year. Hansard’s early table used the relationship “son or daughter” of the principal suspect and separately identified stepchildren in related tables; later ONS releases generally publish the combined parent/step-parent category. Older published totals can differ from later snapshots because Homicide Index cases are reclassified and relationship information is added.
The clearest descriptive pattern is a fall from annual counts commonly in the 40s–70s through 2001 to counts mostly in the teens–30s after the mid-2000s. This does not by itself identify a cause. Population size, age composition, detection, case clearance, recording practice, domestic-violence prevention, child protection, medical care, and other social changes can all affect counts or classification.
For a population denominator, the Australian Institute of Criminology calculated the following England-and-Wales victimization rates from the Home Office Homicide Index. These are rates among children aged 0–15, not the annual counts in the chart:
| Year | 2011 | 2012 | 2013 | 2014 | 2015 |
|---|---|---|---|---|---|
| Parent-killed victims per 100,000 children aged 0–15 | 0.36 | 0.29 | 0.40 | 0.25 | 0.28 |
The latest points are provisional relationship snapshots
- YE March 2024: the original release reported 44 child homicide victims, 19 linked to a parent/step-parent and 19 with no suspect charged. By December 2025, the no-suspect share for that same year had fallen from 43% to 28%, while the parent/step-parent share had risen from 43% to 55%. The chart retains the conversation’s originally published count of 19; it does not silently substitute a value inferred from rounded percentages.
- YE March 2025: the ONS reported 59 victims under 16, 14 linked to a parent/step-parent, and 24 with no suspect charged as of 5 December 2025. The 14 is therefore not a final estimate of parent/step-parent involvement.
Comparability and interpretation limits
- A fall in recorded rates is not a precisely measured fall in true incidence. Earlier hidden deaths are disproportionately absent; later systems also revise cases as investigations and courts progress.
- The numerator changes. Medieval court accusations, early-modern indictments, Victorian coroners’ murder verdicts, registered homicides, and Home Office Homicide Index offenses are not equivalent observations.
- The denominator changes. Some historical points use registered live births, modern ONS infant rates use the resident population under one, and the all-child chart is a count with no population denominator. The scales can be normalized arithmetically without becoming methodologically identical.
- Age boundaries matter. “Infant” means under one in the modern rate series; “neonaticide” is the first 24 hours; the parent/step-parent series stops below age 16 and excludes 16- and 17-year-old children.
- Legal categories change. Statutory infanticide is narrower than descriptive infant killing, while the Homicide Index’s completed-homicide total includes murder, manslaughter, and infanticide.
- Relationship categories and knowledge change. “Son/daughter,” “stepchild,” “parent/step-parent,” and “principal suspect” have not been published identically in every period. Unsolved cases initially lack a relationship and can later move into a familial category.
- Sparse historical points do not justify interpolation. The c.1600–2025 connecting line is not an annual series, and the apparent Victorian peak may partly reflect detection and classification. No causal claim should be derived from the slope between unlike points.
Who commits filicide in the United States?
Mariano, Chan, and Myers analyzed 15,691 arrests recorded in the FBI’s Supplementary Homicide Reports across 32 years. This is the best large U.S. description of accused offenders, but it measures arrests—not convictions, insanity pleas, diagnoses, or final dispositions.
| Accused parent/parent figure | Share of arrests |
|---|---|
| Fathers or father figures | 57.4% |
| Mothers or mother figures | 42.6% |
The four largest accused-parent/victim-sex pairings were:
| Pairing | Share |
|---|---|
| Father figure–son | 29.5% |
| Mother figure–son | 22.1% |
| Mother figure–daughter | 19.7% |
| Father figure–daughter | 18.1% |
The apparent maternal/paternal balance changes with the victim’s age. Fathers and mothers were approximately equally represented in infant killings; paternal predominance rose as the victim became older, reaching 78.3% among adult-offspring victims. In a different denominator—U.S. killings of children under five—Mariano and colleagues summarized an approximate split of 31% fathers and 30% mothers, with the remaining perpetrators outside those two categories or unknown.
Exposure is not measured
These are shares of accused offenders, not rates per hour of childcare, per custodial parent, per household, or per parent in the population. They answer “who appears in recorded filicide arrests?” They do not isolate the effect of parent sex from access, caregiving exposure, victim age, family structure, or reporting and clearance patterns.
Motive and mechanism: Resnick’s typology
Phillip Resnick’s classic psychiatric review proposed five motive types. They are analytic categories rather than statutory defenses:
- Altruistic filicide: the parent believes death benefits the child, sometimes within a suicide plan or delusional effort to save the child from imagined suffering.
- Acutely psychotic filicide: the killing occurs without an intelligible nonpsychotic motive, under hallucinations, delusions, or severe disorganization.
- Unwanted-child filicide: the child is perceived as an obstacle or no longer wanted.
- Accidental/fatal-maltreatment filicide: death results from abuse, neglect, or discipline not necessarily undertaken with a conscious purpose to kill.
- Spouse-revenge filicide: the child is killed to inflict suffering on the other parent.
Real cases can overlap categories. “Altruistic” describes the actor’s perceived purpose, not moral altruism in any objective sense. Evidence of planning does not by itself prove legal sanity: a delusional belief system can generate organized means-end behavior. Conversely, the presence of psychosis does not by itself establish the jurisdiction’s incapacity test.
This heterogeneity matters. A single deterrence, treatment, sentencing, or prevention theory will fit some categories much better than others.
Mental illness and legal responsibility by perpetrator sex
The missing U.S. number
No national U.S. dataset links filicide arrests to insanity pleas, forensic evaluations, verdicts, and dispositions by parent sex. Published studies of mothers already adjudicated NGRI or women already admitted to forensic hospitals are valuable clinical descriptions, but they cannot estimate how often all filicidal mothers succeed with an insanity defense. A number such as “39 mothers found NGRI” has no success-rate meaning without the number of comparable mothers whose defense failed or was never raised.
England and Wales, 1997–2006
Flynn and colleagues identified 342 filicide perpetrators: 45 died by suicide and 297 reached a legal disposition (195 fathers and 102 mothers). Among adjudicated cases:
| Measure | Fathers | Mothers |
|---|---|---|
| Insanity/unfitness outcome | about 1% (2) | about 2% (2) |
| Hospital disposition | 5% (9) | 25% (26) |
| Recorded history of mental disorder | 27% | 66% |
| Symptoms of mental illness at the offense | 23% | 53% |
The insanity/unfitness result was rare for both groups. The much larger hospital-disposition gap should not be relabeled an insanity-verdict gap. Mothers also had substantially more recorded clinical morbidity, so a raw sex disparity cannot by itself identify gender bias or its absence.
Finland, 1970–1994
A Finnish national study by Kauppi and colleagues found mothers in 59%, fathers in 39%, and stepfathers in 2% of 200 filicides. The authors then closely examined a selected “other filicide” subset (records were located in 65 of 69 cases; the parent-sex comparisons comprised 38 mothers and 20 fathers/stepfathers). Neonaticides and filicide-suicides were outside this detailed comparison.
| Selected forensic subset | Mothers | Fathers/stepfathers |
|---|---|---|
| Deemed insane/not responsible | 76% | 18% |
| Psychosis or psychotic depression | 51% | 20% |
Those striking figures describe that selected Finnish subgroup under Finnish law. They are not U.S. defense-success rates. Selection into forensic evaluation, survival to trial, excluded case types, and clinical composition all affect the comparison.
Ontario, Canada, 1985–2018
A 2024 Ontario analysis of 298 filicide cases reported that maternal accused had lower odds than paternal accused of conviction, murder conviction, imprisonment, and sentence length after adjustment. The reported odds ratios for mothers were 0.279 for any conviction, 0.364 for murder conviction, and 0.087 for imprisonment. These are legal-outcome disparities, not direct insanity-acquittal rates, and they do not alone identify whether the cause is clinical case composition, offense circumstances, charging, fact-finding, sentencing, or gendered treatment.
Bias or case composition?
A mother–father difference in raw outcomes can reflect different diagnoses, victim ages, motives, prior abuse, criminal histories, confessions, suicide survival, evidentiary strength, or legal treatment. A persuasive bias claim needs matched cases or multivariable adjustment on legally relevant characteristics—not two unmatched percentages.
How long are insanity acquittees hospitalized?
There is no trustworthy national average limited to parents who killed one or more children and were found NGRI/NCR. Broader evidence supplies context:
| Population | Mean hospitalization | Main limitation |
|---|---|---|
| Insanity acquittees in a 14-state survey | 4.4 years | Mixed offenses and different state systems. |
| Released North Carolina acquittees charged with homicide | 8.1 years (SD 4.2) | One state, released cohort, not filicide-specific. |
| Released North Carolina acquittees charged with nonhomicide offenses | 3.7 years (SD 3.4) | Comparison group, not a filicide estimate. |
| Women in that North Carolina cohort, all offenses | 6.8 years (SD 5.0) | Not limited to homicide or mothers. |
In the North Carolina released cohort, the number of victims was not a statistically significant predictor of hospitalization length. That group-level result does not prevent clinicians and courts from considering multiple victims as part of an individual risk assessment.
Visible cases are illustrations, not an average
- Helen Kirk/McLaughlin (Massachusetts): about 7 years and 5 months from the 2007 NCR verdict to reported release in 2015.
- Angela Vasquez (Massachusetts): NCR in 2009 and reportedly released by December 2015; public reporting supplies an upper bound of roughly six years but not the precise discharge date.
- Deanna Laney (Texas): approximately eight years in a state hospital after a 2004 insanity acquittal.
- Andrea Yates (Texas): approximately 20 years hospitalized after her 2006 insanity acquittal as of 2026. She has repeatedly declined to pursue release, making her duration especially unsuitable as a proxy for compelled confinement.
Do not calculate a “filicide average” from famous cases. They are visible precisely because they are unusual, arise under different laws, and have incomplete reporting. The broad modern homicide-NGRI benchmark is about eight years among released patients in one state; actual filicide confinement can be shorter, last decades, or continue for life.
For the Massachusetts procedure and its application to a live case, see Lindsay Clancy Case - How long could NCR confinement actually last?.
Deterrence: strongest claim and boundary
The ridicule version of the deterrence objection says that a psychotic parent does not need a trial to learn that killing children is wrong. That is a serious criticism of simplistic, severity-based deterrence, but it does not establish that adjudication has literally no deterrent effect.
- Capacity is the threshold issue. Someone who cannot appreciate wrongfulness or conform conduct is a poor target for conventional deterrence. Assuming that incapacity before adjudication, however, assumes the disputed conclusion.
- Filicide is heterogeneous. Revenge, unwanted-child killing, fatal maltreatment, and some planned extended-suicide cases may involve more deterrable agency than acute psychosis.
- Deterrence is marginal. A rule can alter the choices of some responsive people without stopping everyone. Planning, concealment, delay, abandonment, and help-seeking are possible decision points.
- Effects may be upstream and bidirectional. Legal consequences might encourage transferring care, calling for help, or abandoning a plan. Fear of punishment, stigma, or child removal might instead suppress disclosure of violent thoughts. Prevention policy must test both mechanisms.
- Certainty generally matters more than severity. The National Institute of Justice’s evidence summary emphasizes perceived certainty of being caught over increasing already-severe punishments. It does not support assuming that a life sentence adds large deterrence beyond certain intervention, hospitalization, and supervision.
- Criminal adjudication has other functions. Fact-finding, incapacitation, moral communication, recognition of victims, and allocation of blame are distinct from deterrence.
Calibrated conclusion
No identified study shows that prosecuting the Clancy case, or imposing especially severe punishment, measurably deters psychosis-driven maternal filicide. A narrower effect on nonpsychotic or partially responsive perpetrators—and on upstream safety choices—is plausible but unquantified. “No possible deterrence” is logically too strong; “this trial will substantially deter filicide” is empirically unsupported.
Sources
Historical and England–Wales time series
Source status
Modern observations and revision warnings were checked against direct Home Office, Hansard, ONS, and legislation sources. The medieval count was checked against the article’s public abstract, but the paywalled full article was not available in this pass. Some early-modern and Victorian values survive here through scholarly syntheses or reproduced historical tables; they are labeled accordingly rather than presented as modern official statistics.
- Butler, Sara M. (2007). “A Case of Indifference? Child Murder in Later Medieval England.” Journal of Women’s History 19(4), 59–82. The public abstract gives the 131 cases and 144 victims. DOI · public abstract
- Butler, Sara M. “Violence and Murder in Europe,” in The Cambridge World History of Violence. This open chapter explains why surviving medieval records do not support precise incidence measurement. Cambridge PDF · DOI
- Wrightson, Keith (1975). “Infanticide in Earlier Seventeenth-Century England.” Local Population Studies 15, 10–22. The c.1600 reconstruction is a secondary calculation from Wrightson’s estimates; it is not a national official series. journal PDF route
- Roth, Randolph (2001). “Homicide in Early Modern England 1549–1800: The Need for a Quantitative Synthesis.” Crime, Histoire & Sociétés / Crime, History & Societies 5(2), 33–67. article · PDF · DOI
- Sauer, R. (1978). “Infanticide and Abortion in Nineteenth-Century Britain.” Population Studies 32(1), 81–93. PubMed · DOI
- General Register Office historical birth totals for 1838–1840, reproduced in the Registrar-General material scanned in The Registrar-General’s Statistical Review. historical scan · ONS Births in England and Wales summary datasets
- Behlmer, George K. (1979). “Deadly Motherhood: Infanticide and Medical Opinion in Mid-Victorian England.” Journal of the History of Medicine and Allied Sciences 34(4), 403–427. PubMed · DOI
- Rose, Lionel. Massacre of the Innocents: Infanticide in Britain 1800–1939. The reproduced historical table gives 3,225 under-one homicide victims in 1863–1887 and explicitly calls the figures an understatement. Routledge preview containing the table
- Marks, M. N., & Kumar, R. (1993). “Infanticide in England and Wales.” Medicine, Science and the Law 33(4), 329–339. PubMed · DOI
- Home Office. Crime in England and Wales 2001/2002: Supplementary Volume. The infant rate is 46 per million. official statistical bulletin PDF
- Sparks, B., Vione, K., & Fido, D. (2024). “Bad parents? Evaluating judgements of infant homicides.” Uses a Home Office freedom-of-information extract for the 143 infant-homicide relationship profile. open article · DOI
- UK Parliament, Hansard (31 October 2001). “Child Deaths.” The Homicide Index table supplies the calendar-year under-16 parent series for 1977–1997 and warns that cases can be reclassified. Hansard table
- Home Office. Crime in England and Wales 2003/2004: Supplementary Volume 1: Homicide and Gun Crime, table 1.04, for the transitional parent/child relationship series. archived text reproduction
- Home Office. Homicides, Firearm Offences and Intimate Violence 2009/10: Supplementary Volume 2 to Crime in England and Wales. official PDF
- Brown, T. et al. (2019). Filicide in Australia, 2000–2012: A National Study. Table 1 calculates the England-and-Wales 0–15 victimization rates for 2011–2015 from the Home Office Homicide Index. Australian Institute of Criminology report PDF
- Office for National Statistics annual homicide analyses: YE March 2014 · 2015 · 2016 · 2017 · 2018 · 2019 · 2020 · 2021 · 2022 · 2023 · 2024 · 2025 · release archive
- Office for National Statistics. “Appendix tables: homicide in England and Wales.” Detailed Homicide Index tables and revision notes for the latest release. dataset
Population and typology
- Mariano, T. Y., Chan, H. C., & Myers, W. C. (2014). “Toward a More Holistic Understanding of Filicide: A Multidisciplinary Analysis of 32 Years of U.S. Arrest Data.” Forensic Science International 236, 46–53. https://doi.org/10.1016/j.forsciint.2013.12.019
- Brown University. “Filicide in the United States.” Research summary of Mariano et al. https://archive2.news.brown.edu/2007-2015/articles/2014/02/filicide.html
- Resnick, P. J. (1969). “Child Murder by Parents: A Psychiatric Review of Filicide.” American Journal of Psychiatry 126(3), 325–334. https://doi.org/10.1176/ajp.126.3.325
Mental illness and legal outcomes
- Flynn, S. et al. (2013). “Filicide: Mental Illness in Those Who Kill Their Children.” PLOS ONE 8(4): e58981. https://doi.org/10.1371/journal.pone.0058981
- Kauppi, A., Kumpulainen, K., Karkola, K., Vanamo, T., & Merikanto, J. (2010). “Maternal and Paternal Filicides: A Retrospective Review of Filicides in Finland.” Journal of the American Academy of Psychiatry and the Law 38(2), 229–238. https://jaapl.org/content/38/2/229
- Johnson, A., & Dawson, M. (2024). “Filicide and Criminal Justice Outcomes: Are Maternal and Paternal Perpetrators Treated Differently?” Child Abuse & Neglect 157:107019. https://doi.org/10.1016/j.chiabu.2024.107019
- Friedman, S. H., Hrouda, D. R., Holden, C. E., Noffsinger, S. G., & Resnick, P. J. (2005). “Child Murder Committed by Severely Mentally Ill Mothers: An Examination of Mothers Found Not Guilty by Reason of Insanity.” Journal of Forensic Sciences 50(6), 1466–1471. This is a 39-case NGRI clinical sample, not a national defense-success denominator. https://pubmed.ncbi.nlm.nih.gov/16382847/
Hospitalization and deterrence
- Haroon, H., Wolfe, N., Feizi, S., & Barboriak, P. (2023). “Assessing Two Decades of Insanity Acquittee Release from the North Carolina Forensic Program.” Journal of the American Academy of Psychiatry and the Law 51(3), 342–352. https://jaapl.org/content/51/3/342
- WCVB 5 Investigates. “Insanity Defense Leads to Early Releases in Sometimes-Horrific Crimes” (2015), reporting the McLaughlin and Vasquez Massachusetts dispositions. https://www.wcvb.com/article/insanity-defense-leads-to-early-releases-in-sometimes-horrific-crimes/8229689
- KLTV. “Deanna Laney Out of Mental Institution” (2012). https://www.kltv.com/story/18620253/deanna-laney-out-of-mental-institution/
- TIME. “The Story Behind the New Andrea Yates Documentary The Cult Behind the Killer” (2026). https://time.com/7343680/andrea-yates-true-story-the-cult-behind-the-killer/
- National Institute of Justice. “Five Things About Deterrence.” https://nij.ojp.gov/library/publications/five-things-about-deterrence
- Garcia v. Commonwealth, 487 Mass. 97 (2021). https://law.justia.com/cases/massachusetts/supreme-court/volumes/487/487mass97.html
- Massachusetts General Laws c. 123, §§ 8 and 16. https://malegislature.gov/Laws/GeneralLaws/PartI/TitleXVII/Chapter123/Section8 and https://malegislature.gov/Laws/GeneralLaws/PartI/TitleXVII/Chapter123/Section16
Research questions
- Can a single revised-vintage Homicide Index extract replace the stitched 1977–2025 parent/step-parent snapshot while preserving the calendar-to-financial-year break and exact relationship definitions?
- Is there a recent U.S. state-level linked dataset that records filicide defendants from charge through plea, forensic evaluation, verdict, and disposition?
- Can parental exposure to children and custody status be incorporated into maternal/paternal perpetration-rate estimates?
- In matched filicide cases, how much of the sex difference in legal outcomes remains after diagnosis, victim age, motive, prior abuse, criminal history, and filicide-suicide are controlled?
- Do confidential perinatal-mental-health interventions increase disclosure without creating a credible fear of automatic punishment or child removal?
- What predicts safe conditional release after homicide-NGRI commitment, and how much do state review practices—not clinical risk—drive length of stay?