Polling
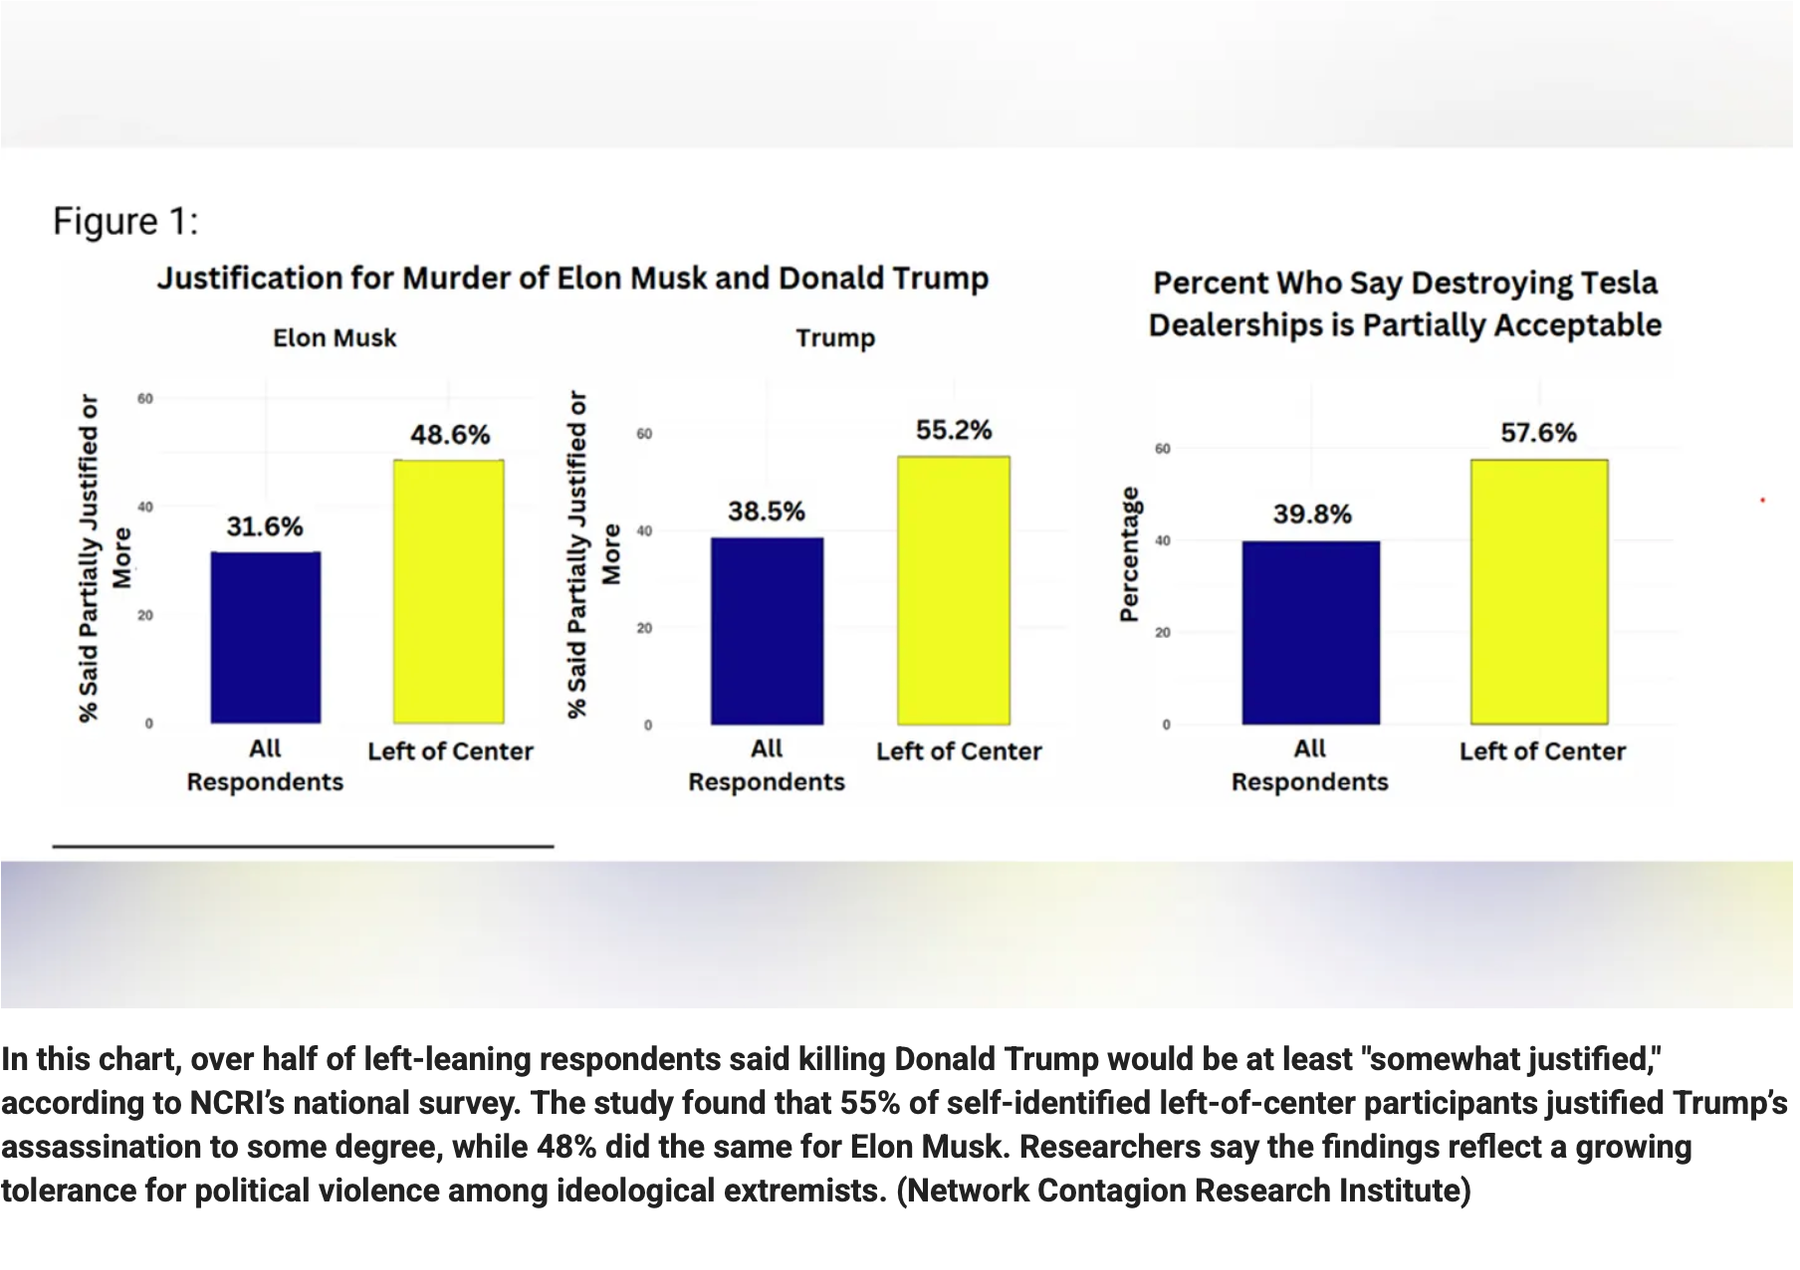
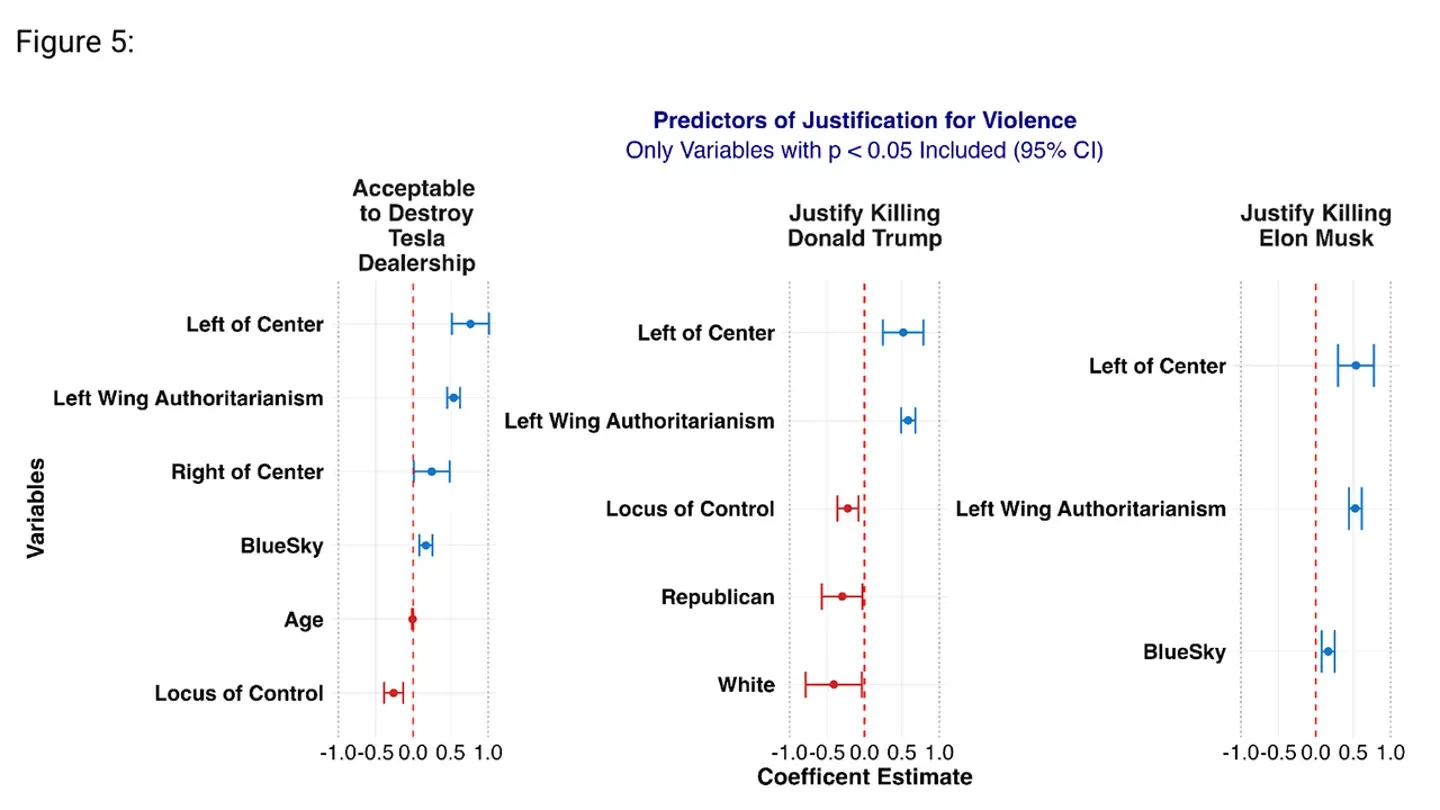
Study reveals 'assassination culture' spreading on the left
Finkelstein said that while some level of violent sentiment exists on the right, “What we found was a statistically higher endorsement of political murder on the left, 41% more than among right-leaning participants.”
The report singles out BlueSky, a social media platform favored by progressive users, as a major amplifier of extremist ideation.
Attachment (file not included in this release)
YouGov Polling
In a November 2017 YouGov poll, when asked if violence was justified to advance political goals, only 8% of Democrats and Republicans said it was “at least a little bit justified.” Although the pollster stopped asking the question in the same way in 2020, the percentage of people who said it was at least “a little” justified had already risen to 36% among Republican respondents and 33% among Democratic respondents.
In the latest poll by YouGov taken after Kirk was murdered, 11% said violence can sometimes be justified to achieve political goals, while 72% said violence is never justified. (Another 5% said they would prefer not to say whether they think violence is sometimes justifiable to achieve political goals.)
Saying that violence can be justified was more prominent among Democrats and independents than among Republicans, with 14% of Democrats, 13% of independents, and only 6% of Republicans holding that opinion, according to the Sept. 10 poll. On the other end of the scale, 81% of Republicans said violence is never justified, compared with 72% of Democrats and 65% of independents.
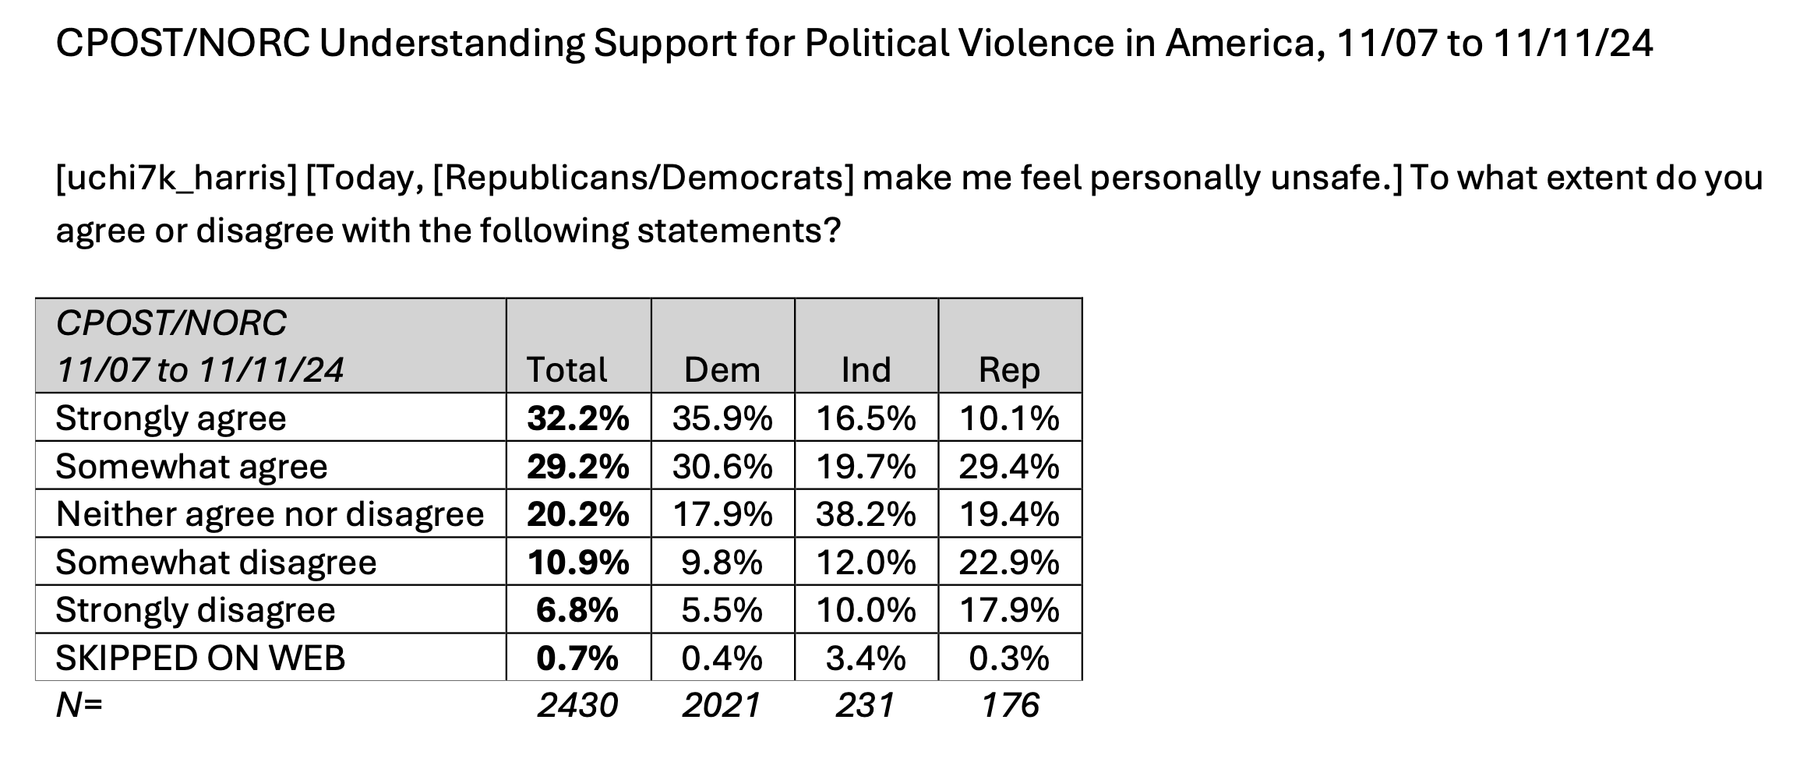
UChicago November 2024 CPOST Post Election Understanding Political Violence Survey Topline
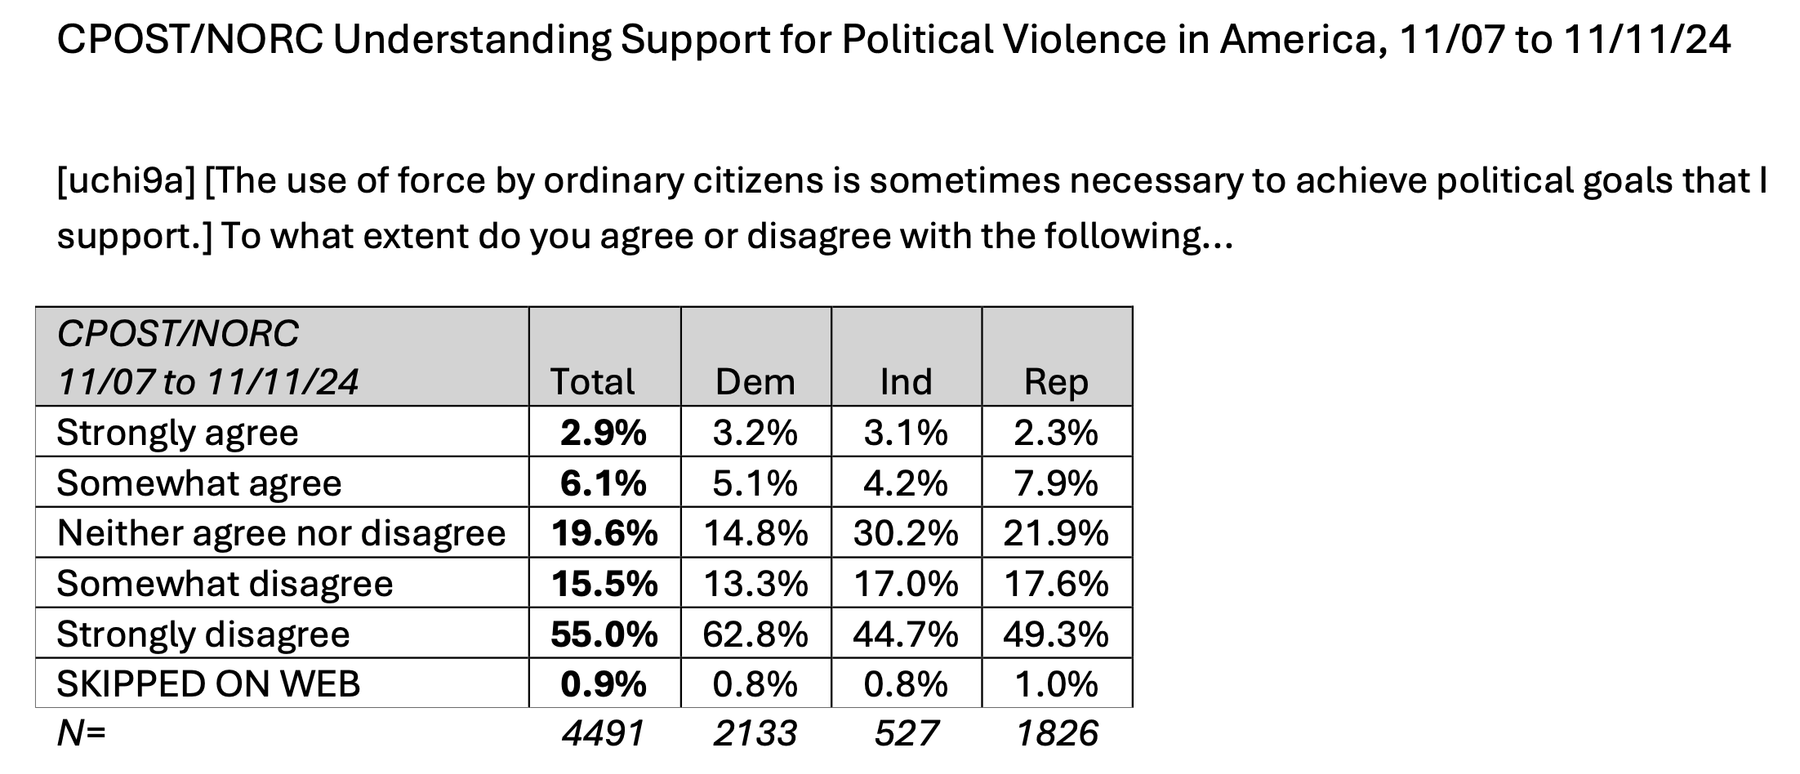
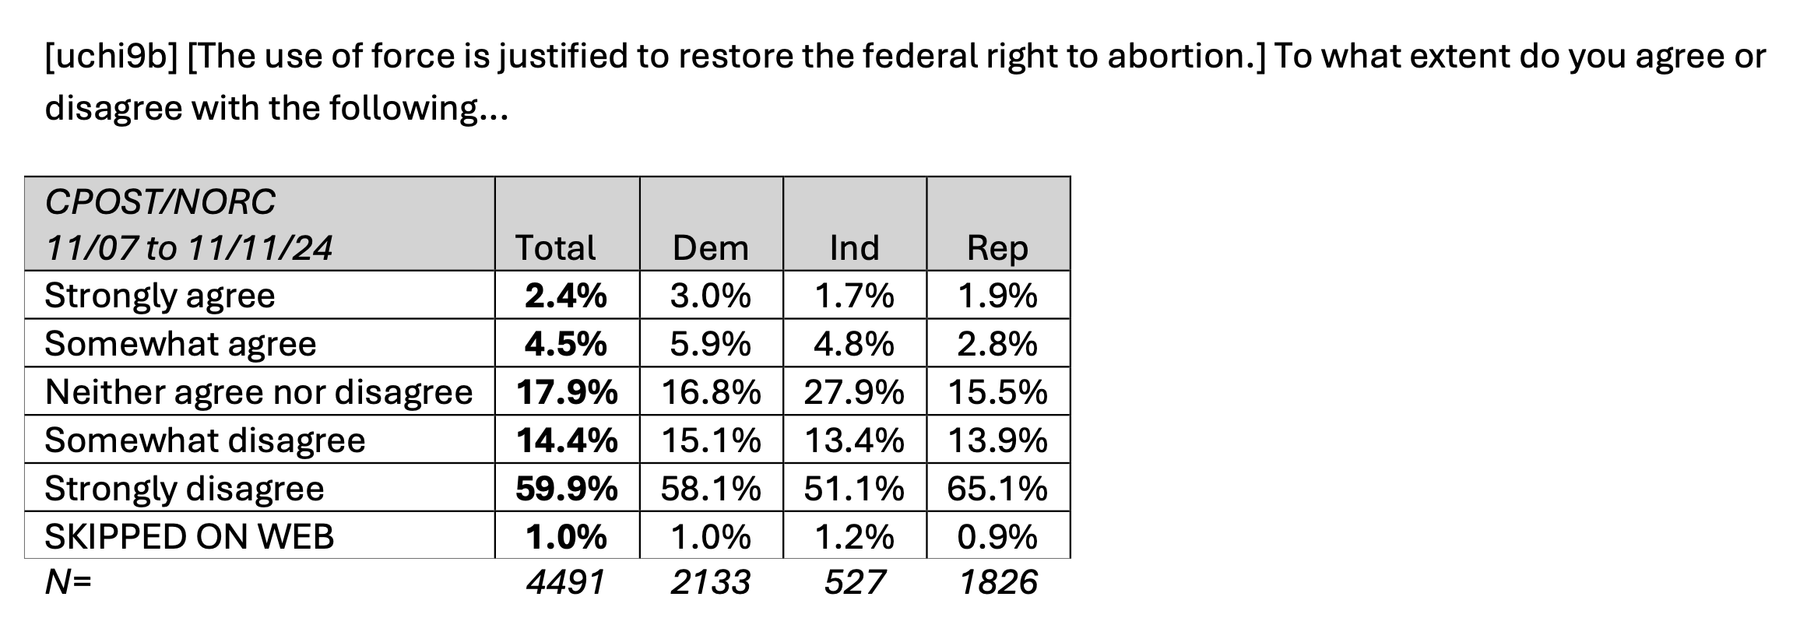
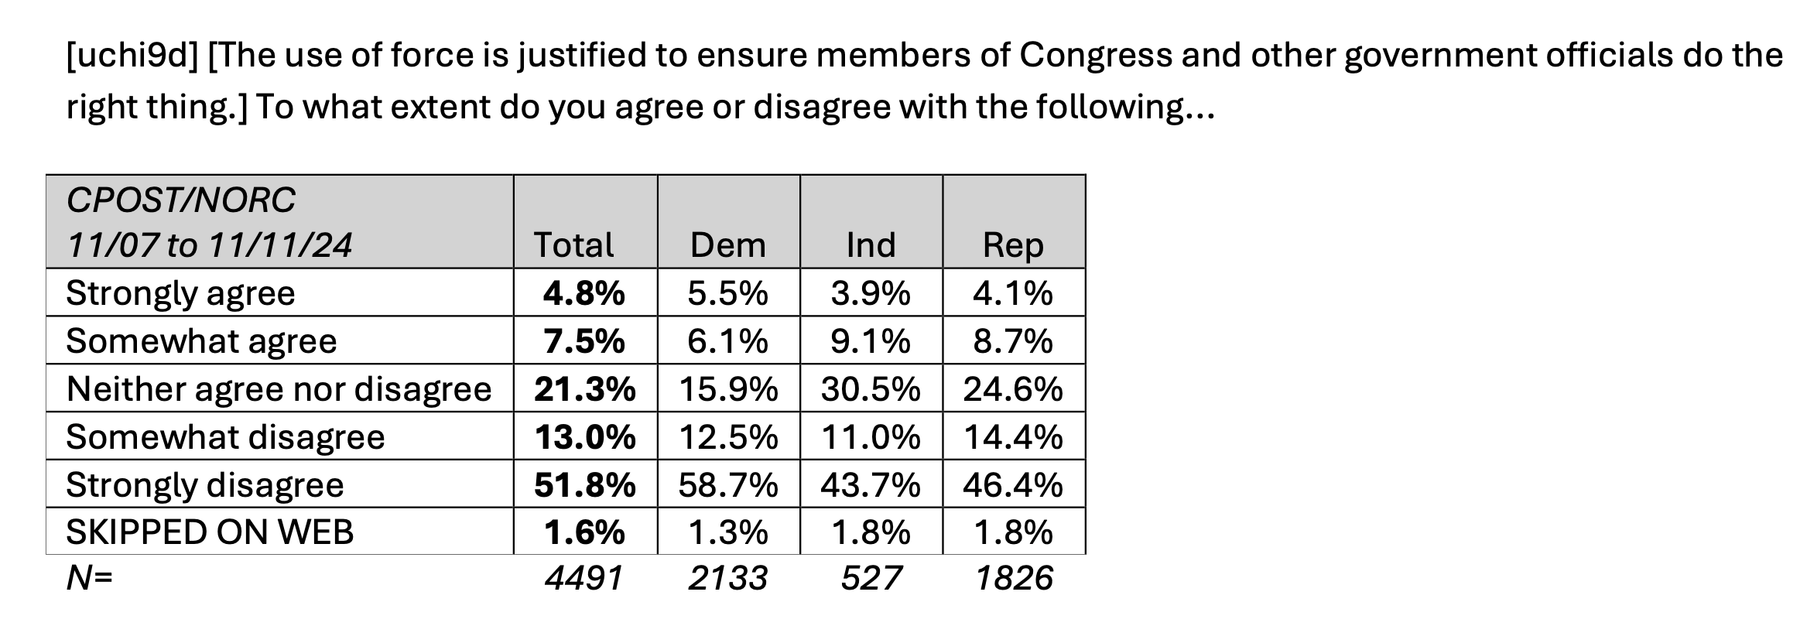
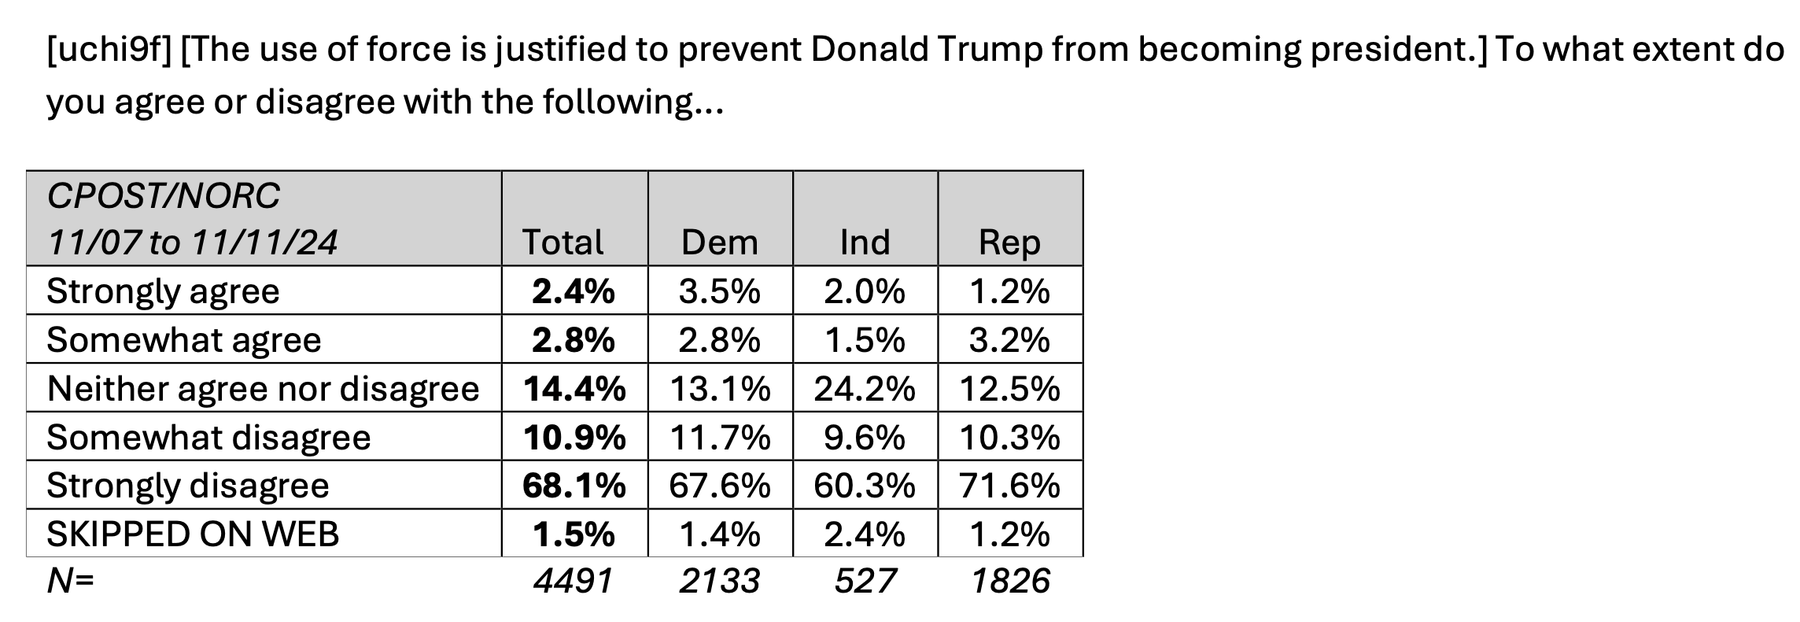
POLL: NEARLY HALF OF AMERICANS THINK MEMBERS OF THE OPPOSING POLITICAL PARTY ARE 'EVIL'
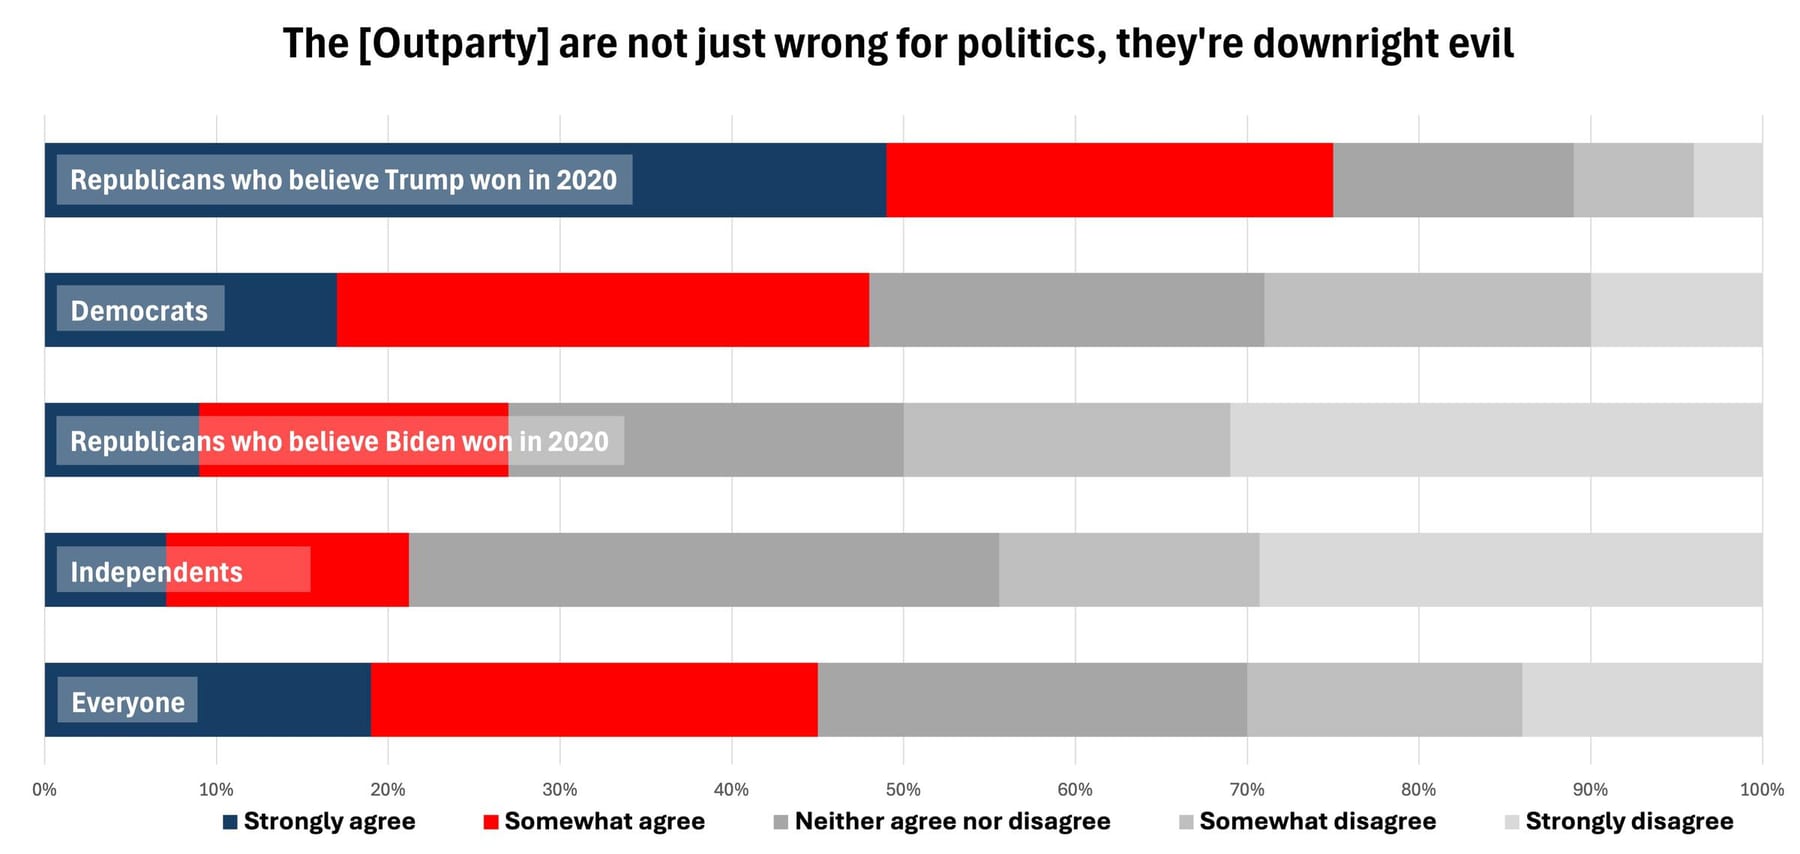
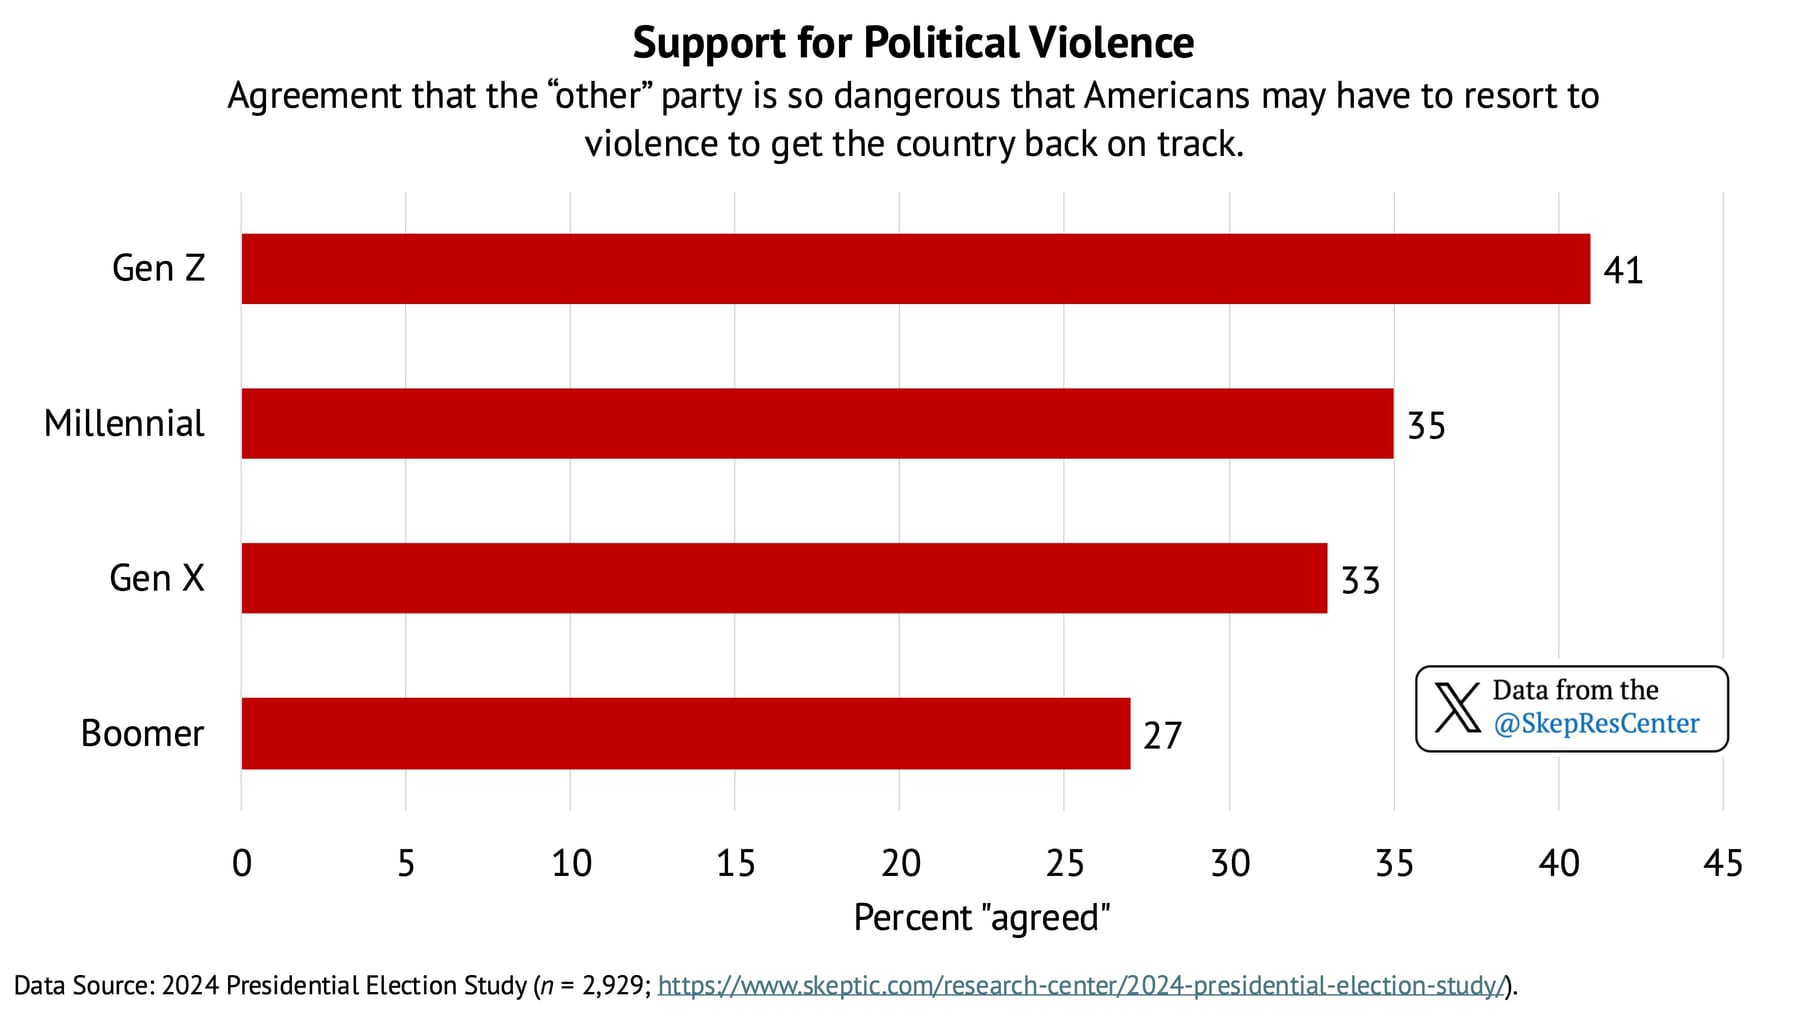
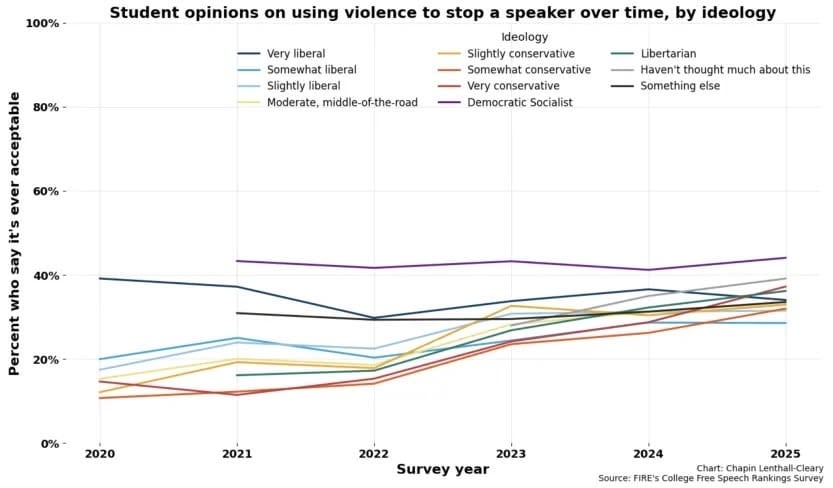
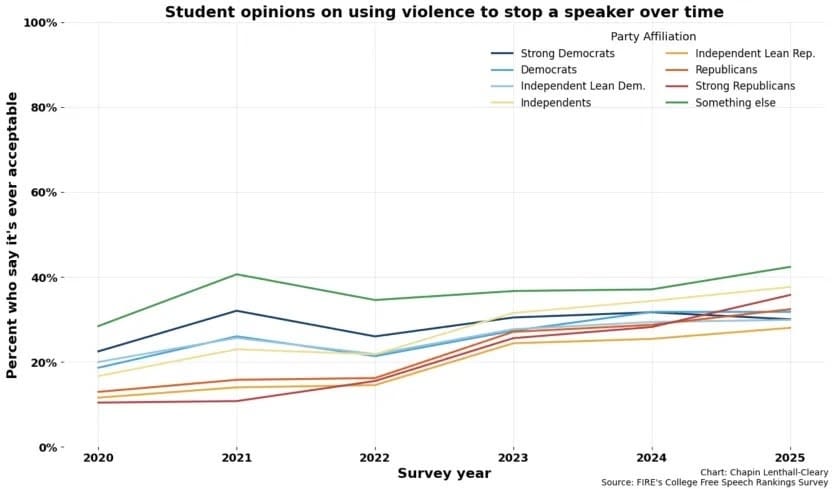
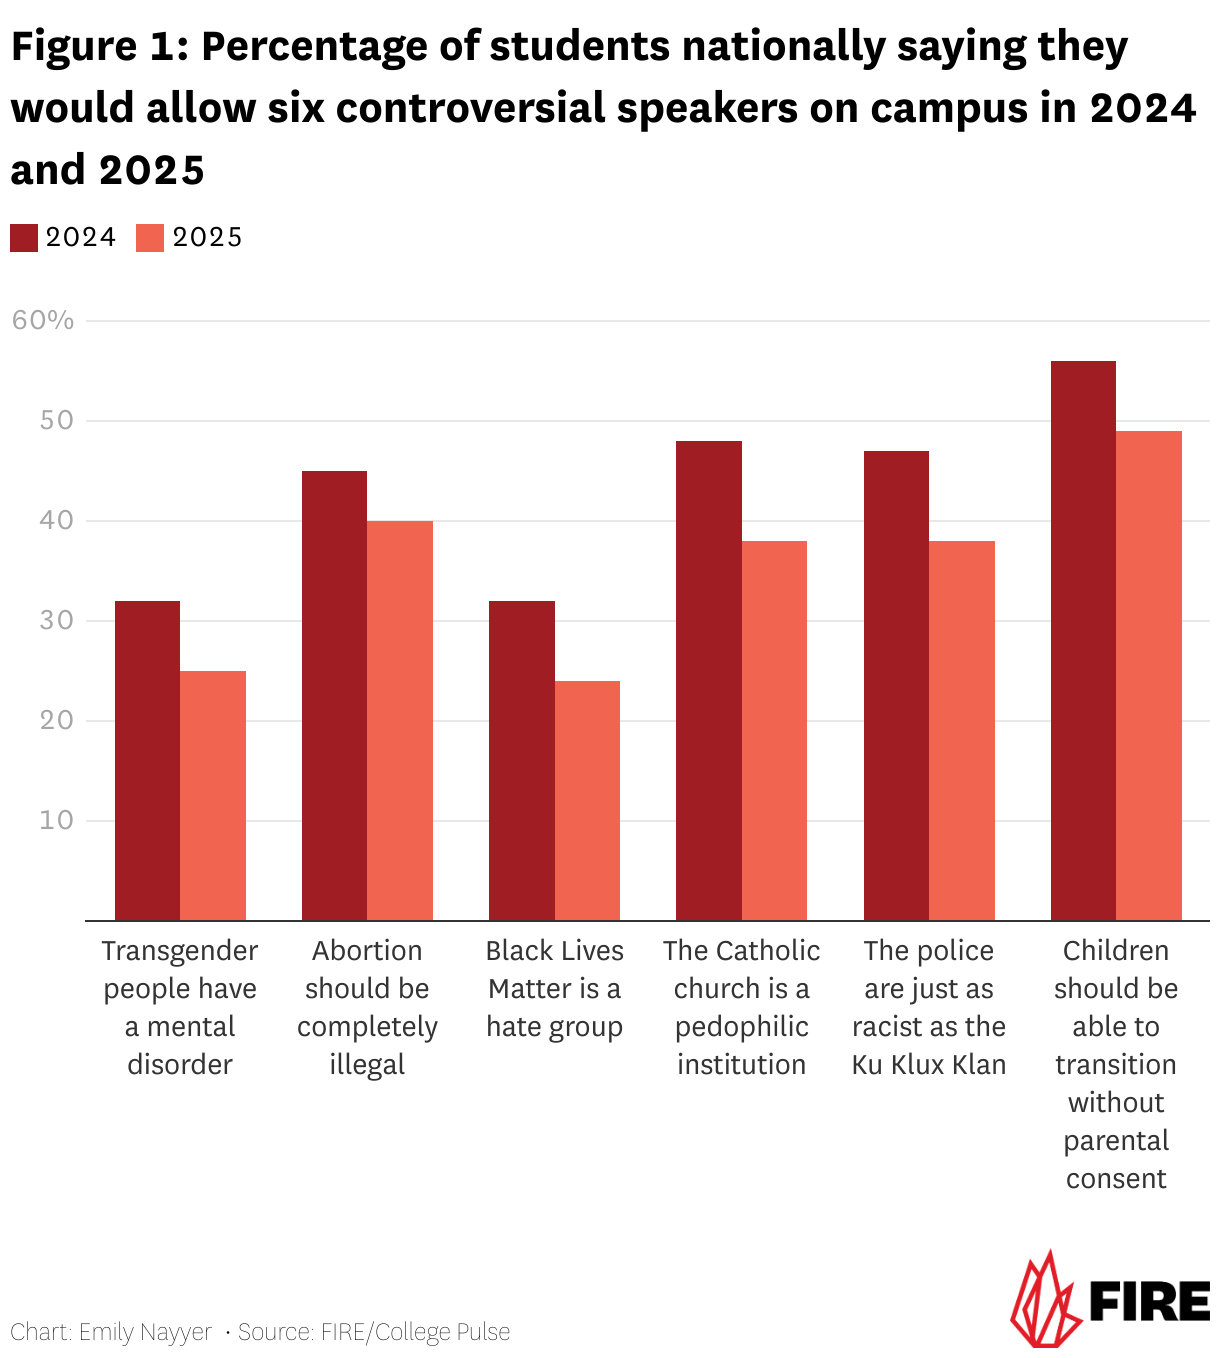
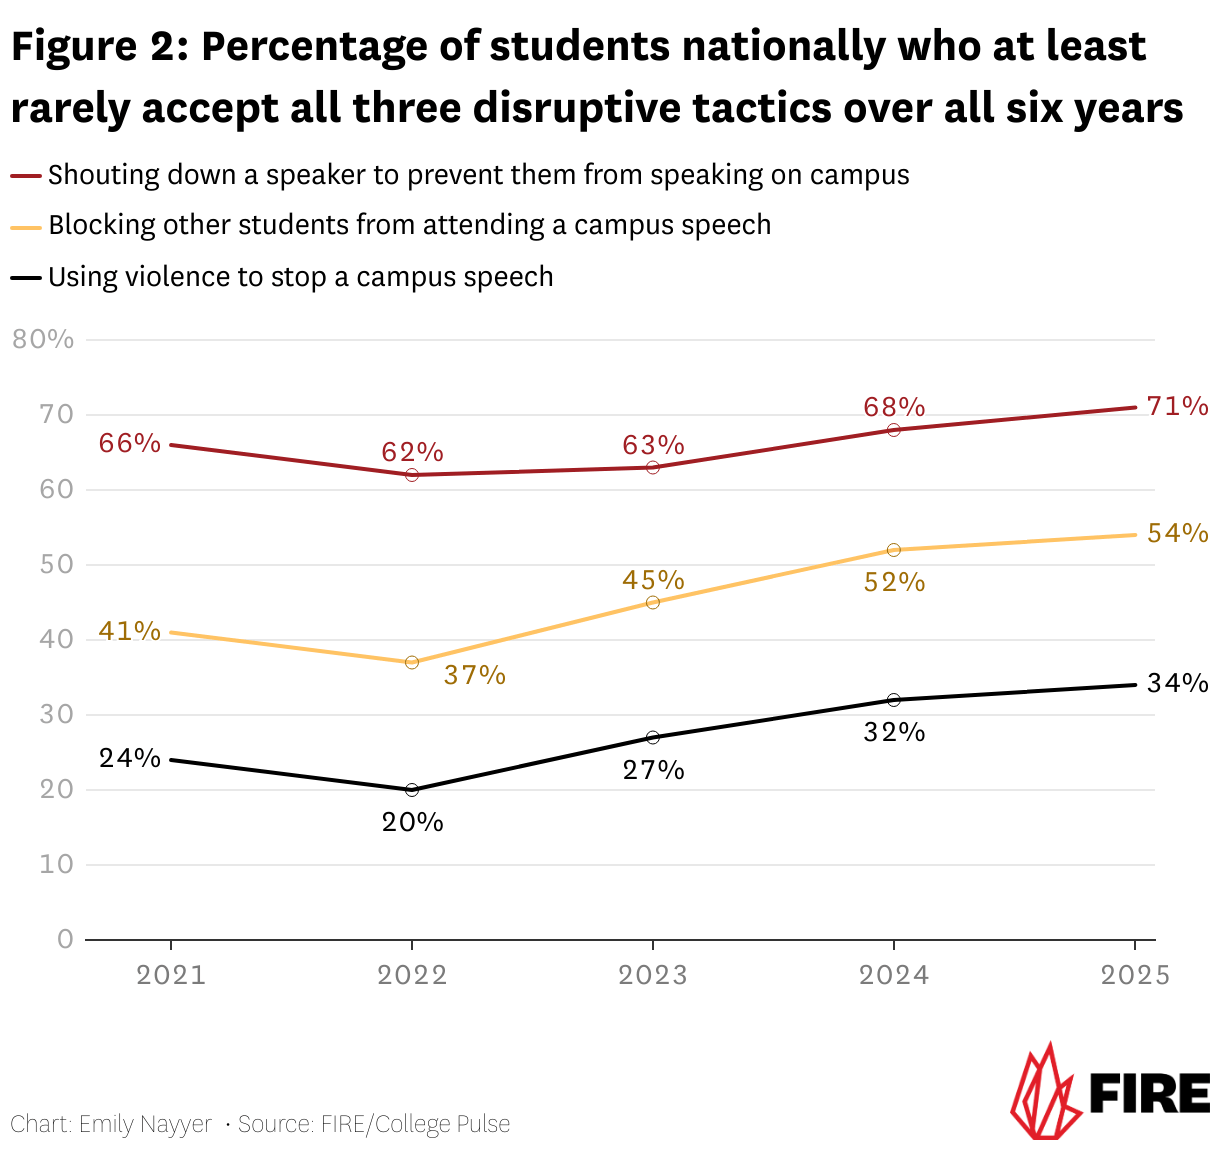
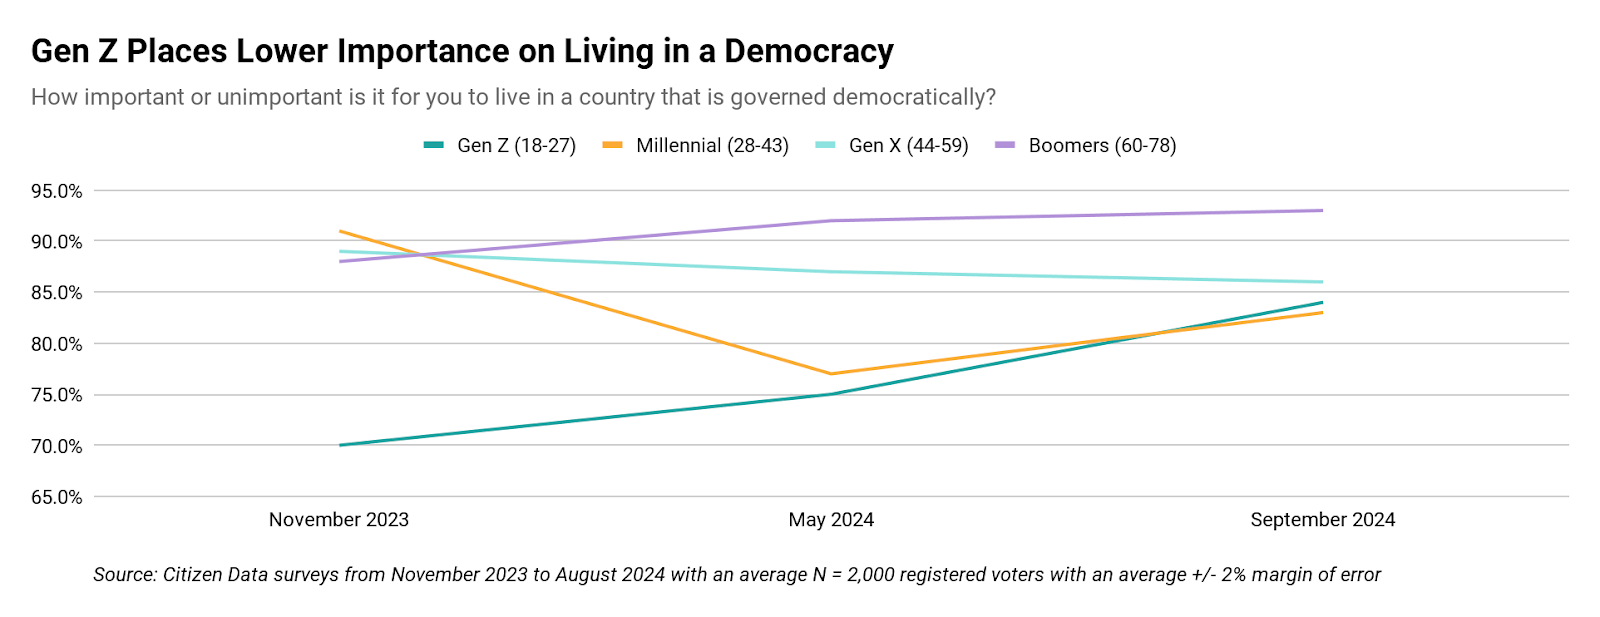
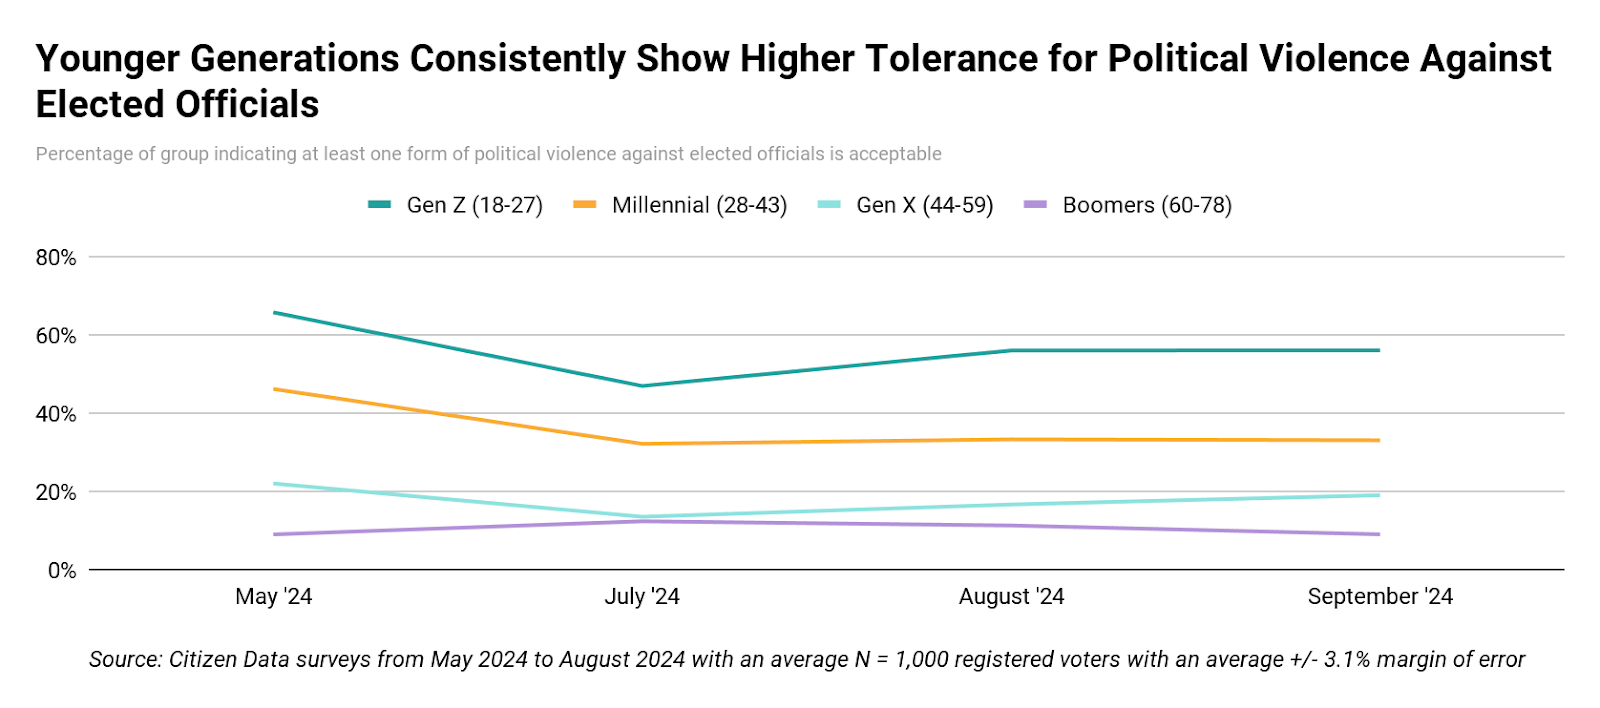
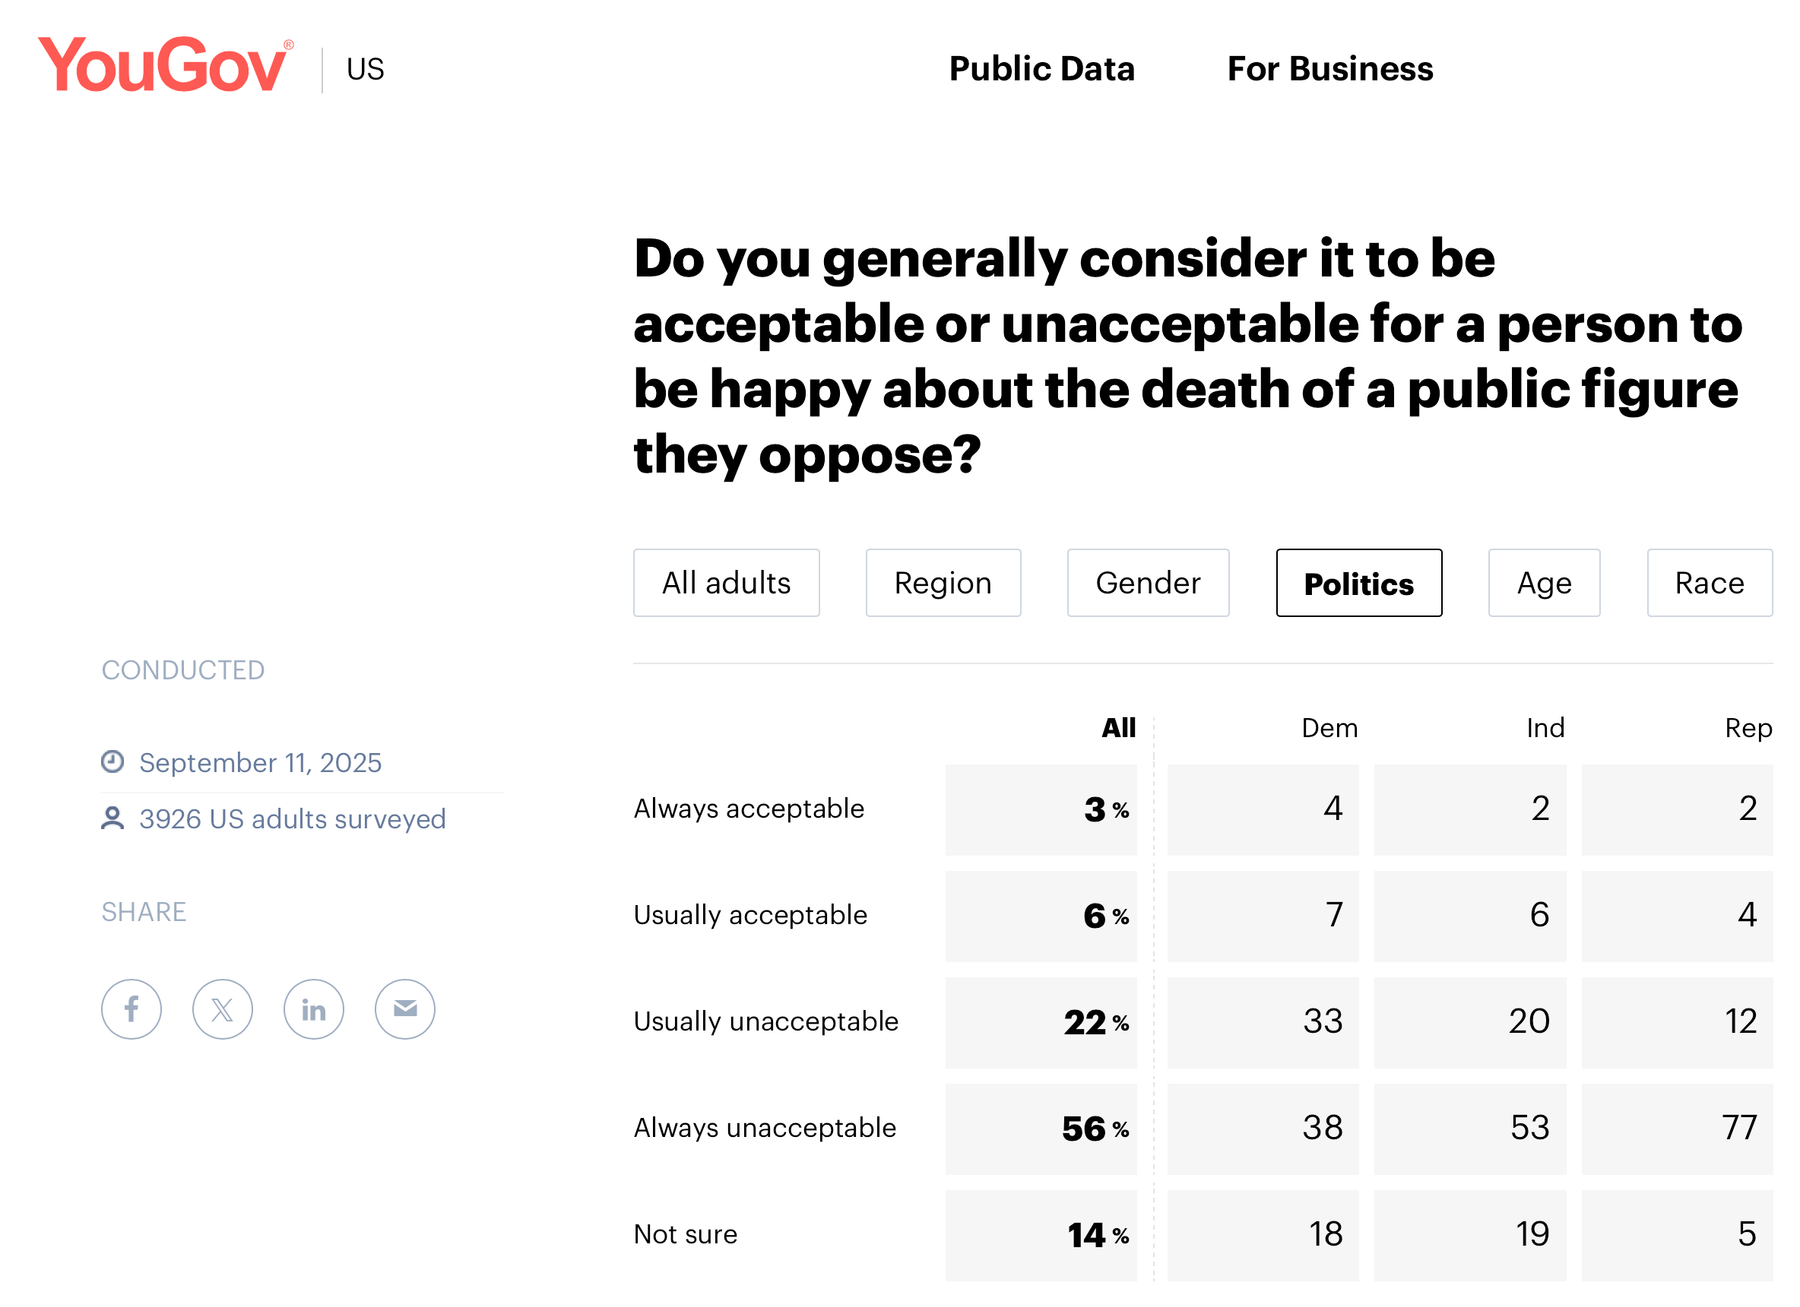
Additional Polling
Below is an extensive polling inventory of U.S. surveys that ask some version of whether violence, force, or violent action is acceptable, justified, or necessary for political/social change. The biggest caveat: question wording changes the result dramatically. Broad wording like “violence to achieve political goals” usually gets low support. More situational or emotionally loaded wording like “save the country,” “protect America,” “remove Trump,” or “stop protests” can produce much higher agreement.
Main takeaway
Across most polls, large majorities of both Republicans and Democrats reject political violence, but minority support appears in both parties. The pattern shifts depending on wording:
- Generic political violence: Democrats sometimes show slightly higher support than Republicans in recent 2025 polls.
- “Save the country/traditional way of life/protect America” framing: Republicans often show higher support.
- Trump-specific questions: Democrats show higher support for force against Trump; Republicans show higher support for force on behalf of Trump or against protests.
- Issue-specific questions: support can appear on either side depending on the issue.
Polling list
1. PRRI, 2023: “True American patriots may have to resort to violence”
Pollster/source: Public Religion Research Institute
Date: October 2023 report
Question wording: Agreement with: “Because things have gotten so far off track, true American patriots may have to resort to violence in order to save our country.”
Results:
| Group | Agree |
|---|---|
| All Americans | 23% |
| Republicans | 33% |
| Independents | 22% |
| Democrats | 13% |
PRRI noted that support rose from 15% in 2021 to 23% in 2023, and among Republicans from 28% in 2021 to 33% in 2023. Republicans favorable toward Trump were much more likely to agree than Republicans unfavorable toward Trump, 41% vs. 16%.
Why it matters: This is one of the most-cited measures because it uses a “save the country” frame, which tends to activate defensive/patriotic justification rather than abstract approval of violence.
2. Survey Center on American Life, January 2021: “Use force to save traditional American way of life”
Pollster/source: Survey Center on American Life, American Perspectives Survey
Date: January 21–30, 2021
Question wording: Agreement with: “The traditional American way of life is disappearing so fast that we may have to use force to save it.”
Results:
| Group | Agree |
|---|---|
| All Americans | 36% |
| Republicans | 56% |
| Independents | 35% |
| Democrats | 22% |
The same survey found that 60% of Americans rejected the idea, but the partisan split was large.
Why it matters: This is not a generic “political violence” question. It asks about force in defense of a perceived threatened “traditional American way of life,” which explains why Republican support is much higher.
3. Survey Center on American Life, January 2021: “Violent actions if elected leaders will not protect America”
Pollster/source: Survey Center on American Life, American Perspectives Survey
Date: January 21–30, 2021
Question wording: Agreement with: “If elected leaders will not protect America, the people must do it themselves even if it requires taking violent actions.”
Results:
| Group | Agree |
|---|---|
| All Americans | 29% |
| Republicans | 39% |
| Independents | 31% |
| Democrats | 17% |
The report also emphasized that “complete” agreement was much smaller: 9% of all Americans and 13% of Republicans completely agreed.
Why it matters: This wording combines self-defense, failed leadership, and protection of America, which makes it more permissive than a neutral “political goals” question.
4. UC Davis Violence Prevention Research Program, 2022: violence “usually or always justified” for at least one political objective
Pollster/source: UC Davis Violence Prevention Research Program
Date: 2022 survey, published/discussed in 2022–2023
Question structure: Respondents were asked whether violence was justified to advance specific political objectives.
Key result:
| Group | Endorsed violence as usually/always justified for at least one of 17 political objectives |
|---|---|
| Overall | 32.8% |
UC Davis reported that nearly one-third of respondents considered violence usually or always justified for at least one of 17 objectives, such as preventing discrimination, stopping an election from being stolen, or stopping voter fraud/intimidation.
Partisan note: UC Davis later summarized related research by saying Republicans were, overall, more likely than Democrats to endorse physical force or violence for specific political objectives.
Why it matters: This is a broader “menu of objectives” approach. It tends to produce higher numbers because respondents may reject most violence but endorse one scenario.
5. UC Davis, 2022: MAGA Republicans vs. other Republicans vs. non-Republicans
Pollster/source: UC Davis Violence Prevention Research Program
Date: 2022
Question structure: Whether violence was usually or always justified to advance at least one of 17 political objectives.
Results:
| Group | Violence usually/always justified for at least one objective |
|---|---|
| MAGA Republicans | 58.2% |
| Strong Republicans | 38.3% |
| Other Republicans | 31.5% |
| Non-Republicans | 25.1% |
UC Davis defined “MAGA Republicans” as Republicans who voted for Trump in 2020 and strongly/very strongly agreed that the 2020 election was stolen and Biden was illegitimate.
Why it matters: This is one of the clearest examples showing that subgroups inside a party can differ more than the parties overall.
6. CPOST/NORC, September 2024: “Use of force justified to prevent Donald Trump from becoming president”
Pollster/source: Chicago Project on Security and Threats / NORC
Date: September 12–16, 2024
Question wording: “The use of force is justified to prevent Donald Trump from becoming president.”
Results:
| Group | Strongly agree | Agree | Total agree |
|---|---|---|---|
| All adults | 3.8% | 4.4% | 8.2% |
| Democrats | 5.0% | 4.9% | 9.9% |
| Independents | 3.9% | 4.6% | 8.5% |
| Republicans | 2.4% | 3.8% | 6.2% |
Why it matters: In 2024, before Trump returned to office, support for force to prevent him from becoming president was under 10% overall, though not zero.
7. CPOST/NORC, September 2024: “Use of force justified to restore Donald Trump to the presidency”
Pollster/source: Chicago Project on Security and Threats / NORC
Date: September 12–16, 2024
Question wording: “The use of force is justified to restore Donald Trump to the presidency.”
Results:
| Group | Strongly agree | Agree | Total agree |
|---|---|---|---|
| All adults | 2.9% | 2.9% | 5.8% |
| Democrats | 2.2% | 2.8% | 5.0% |
| Independents | 1.2% | 0.7% | 1.9% |
| Republicans | 4.4% | 3.9% | 8.3% |
Why it matters: This is the right-wing parallel to the previous anti-Trump question. Republican support was higher than Democratic support, but still a minority.
8. CPOST/NORC, May 2025: “Use of force justified to remove Donald Trump from the presidency”
Pollster/source: Chicago Project on Security and Threats / NORC
Date: May 1–5, 2025
Question wording: “The use of force is justified to remove Donald Trump from the presidency.”
Results:
| Group | Strongly agree | Agree | Total agree |
|---|---|---|---|
| All adults | 12.0% | 9.4% | 21.4% |
| Democrats | 22.7% | 16.2% | 38.9% |
| Independents | 9.3% | 7.1% | 16.4% |
| Republicans | 1.2% | 2.7% | 3.9% |
Why it matters: This is one of the most alarming recent findings because the Democratic number is high. It should be read carefully, though: it is an “agree/disagree” item about “force,” not necessarily a direct behavioral question asking whether the respondent personally would commit violence.
9. CPOST/NORC, May 2025: “Trump justified using the U.S. military to stop protests”
Pollster/source: Chicago Project on Security and Threats / NORC
Date: May 1–5, 2025
Question wording: “Donald Trump is justified using the U.S. military to stop protests against the Trump agenda.”
Results:
| Group | Strongly agree | Agree | Total agree |
|---|---|---|---|
| All adults | 4.1% | 8.2% | 12.3% |
| Democrats | 1.3% | 2.9% | 4.2% |
| Independents | 0.3% | 7.7% | 8.0% |
| Republicans | 9.1% | 14.4% | 23.5% |
Why it matters: This flips the partisan pattern: Republicans were more likely to support state/military force against anti-Trump protests.
10. CPOST/NORC, May 2025: “Use of force against Tesla dealerships and cars is justified”
Pollster/source: Chicago Project on Security and Threats / NORC
Date: May 1–5, 2025
Question wording: “The use of force against Tesla dealerships and cars is justified.”
Results:
| Group | Strongly agree | Agree | Total agree |
|---|---|---|---|
| All adults | 3.8% | 5.8% | 9.6% |
| Democrats | 6.4% | 9.1% | 15.5% |
| Independents | 0.9% | 1.9% | 2.8% |
| Republicans | 2.1% | 3.7% | 5.8% |
Why it matters: This is issue-specific, not general political violence. It shows that support can rise within a party when the target is associated with a disliked political/economic symbol.
11. CPOST/NORC, May 2025: bipartisan condemnation of political violence
Pollster/source: Chicago Project on Security and Threats / NORC
Date: May 1–5, 2025
Question wording: “Republicans and Democrats in Congress should make a joint statement condemning any political violence in America.”
Results:
| Group | Strongly agree | Agree | Total agree |
|---|---|---|---|
| All adults | 42.3% | 27.0% | 69.3% |
| Democrats | 45.0% | 25.6% | 70.6% |
| Independents | 28.8% | 20.9% | 49.7% |
| Republicans | 45.5% | 31.4% | 76.9% |
Why it matters: Even in a poll that found troubling support for some uses of force, a large majority still supported a bipartisan statement condemning political violence.
12. Economist/YouGov, September 2025: “Violence is never justified to achieve political goals”
Pollster/source: Economist/YouGov
Date: September 12–15, 2025
Question wording: Whether violence is justified in order to achieve political goals.
Results:
| Group | Say violence is never justified |
|---|---|
| All Americans | 78% |
| Democrats | 75% |
| Republicans | 89% |
Implied inverse: Since the source reports “never justified,” this suggests Democrats were less likely than Republicans to reject political violence in this generic formulation. But the exact “sometimes justified” partisan number is not given in the quoted summary.
Why it matters: This generic wording produces much lower support for political violence than the “save the country” or Trump-specific CPOST wording.
13. YouGov, September 2025: “Citizens resort to violence to achieve political goals”
Pollster/source: YouGov
Date: September 11, 2025
Question wording: “Do you think it is ever justified for citizens to resort to violence in order to achieve political goals?”
Results:
| Group | Result |
|---|---|
| All adults saying “Yes, violence can sometimes be justified” | 11% |
| All adults saying “No, violence is never justified” | 72% |
YouGov’s article says younger and more liberal Americans were more likely than older or conservative Americans to say political violence can sometimes be justified, but it remained a minority view. Among the “very liberal,” 25% said political violence can sometimes be justified; among adults under 30, 19% said it can.
Why it matters: This is close to the cleanest wording for “political violence in general,” and the overall support is much lower than issue-specific surveys.
14. Marquette Law School Poll, October 2025: “Violence can sometimes be justified”
Pollster/source: Marquette Law School Poll
Date: October 1, 2025 release
Question wording: Whether violence is never justified or can sometimes be justified in order to achieve political goals.
Results:
| Group | Say violence can sometimes be justified |
|---|---|
| All adults | 11% |
| Democrats | 15% |
| Republicans | 6% |
| Under 30 | 14% |
| Age 60+ | 5% |
| Very liberal | 25% |
| Very conservative | 10% |
Marquette also reported that 89% overall said violence is never justified.
Why it matters: This closely matches YouGov’s 11% overall result, but gives a clearer partisan split: Democrats 15%, Republicans 6%.
15. Gallup/Kettering Foundation, 2025: “Sometimes OK to use violence to achieve a political goal”
Pollster/source: Gallup / Kettering Foundation Democracy for All Project
Date: Survey conducted July 7–August 25, 2025; published December 2025
Question wording: Whether it is “never OK” or “sometimes OK” to use violence to achieve a political goal.
Results:
| Group | Result |
|---|---|
| All Americans saying “sometimes OK” | 16% |
| All Americans saying “never OK” | About five in six |
Gallup says age is the strongest predictor, young adults are more likely to say violence is sometimes OK, and partisan differences are smaller than age/gender/social-isolation differences. Gallup highlights that 45% of men ages 18–29 who always/often feel lonely said political violence is sometimes acceptable.
Why it matters: This suggests the political-violence problem is not only partisan; age, gender, loneliness, and alienation may be major predictors.
16. Pew Research Center, October 2025: elected officials who support groups advocating violence
Pollster/source: Pew Research Center
Date: October 2025
Question wording: Whether one’s party should be accepting of elected officials who support groups that advocate violence against the other party.
Results:
| Group | Say their party should be “not at all” accepting |
|---|---|
| Republicans | 70% |
| Democrats | 68% |
Pew summarizes this as overwhelming rejection in both parties of elected officials who support groups advocating violence against the other party.
Why it matters: This is less about whether violence can ever be justified and more about party tolerance for violence-supporting politicians. It shows broad bipartisan rejection.
Related but slightly different polling
17. Pew Research Center, 2025: politically motivated violence is increasing
Pollster/source: Pew Research Center
Date: October 2025
Question wording: Whether politically motivated violence is increasing.
Results:
| Group | Say politically motivated violence is increasing |
|---|---|
| All Americans | 85% |
| Republicans/Republican leaners | 86% |
| Democrats/Democratic leaners | 85% |
Pew also found that similar shares saw left-wing and right-wing extremism as major problems.
Why it matters: This does not ask whether violence is acceptable, but it shows bipartisan perception that political violence is worsening.
18. Marist/NPR/PBS, 2025: concern about political violence
Pollster/source: NPR/PBS News/Marist
Date: June 23–25, 2025
Question wording: Concern about democracy/political violence after violent incidents involving Minnesota lawmakers.
Results reported:
| Group | Democracy at risk / major concern framing |
|---|---|
| Democrats | 89% |
| Independents | 80% |
| Republicans | 57% |
A report on the poll said 73% of Americans viewed political violence as a major concern.
Why it matters: Again, not an “acceptable violence” question, but useful context: concern about political violence is itself partisan, with Democrats more alarmed in that poll.
Best way to interpret all of this
The safest conclusion
Most Republicans and Democrats reject political violence. But there are meaningful minorities in both parties who say violence or force can be justified under certain conditions.
The partisan pattern depends heavily on the frame
| Frame | Which side tends to show more support? |
|---|---|
| “Save the country” / “traditional way of life” / “protect America” | Republicans higher |
| “Remove/prevent Trump” | Democrats higher |
| “Restore Trump” / “military to stop anti-Trump protests” | Republicans higher |
| Generic “violence to achieve political goals” | Recent 2025 polls show Democrats/liberals somewhat higher, but still minority |
| Specific symbolic economic targets, e.g. Tesla | Democrats higher in CPOST May 2025 |
| Condemning political violence generally | Broad bipartisan agreement |
Why the numbers vary so much
A poll asking “Is political violence ever justified?” is not the same as asking:
- “May true patriots need violence to save the country?”
- “May we use force to protect the traditional American way of life?”
- “Is force justified to remove Trump?”
- “Is the military justified in stopping protests?”
- “Is violence against property justified?”
Each version activates different moral intuitions: self-defense, revolution, anti-authoritarianism, law-and-order, anti-fascism, anti-communism, anti-elite anger, or fear of social collapse.
Most important caution
Some of the highest numbers come from agree/disagree survey items, which can overstate support because respondents may “somewhat agree,” be inattentive, interpret “force” broadly, or endorse a symbolic sentiment rather than actual violence. But even with that caveat, the repeated finding across PRRI, UC Davis, CPOST/NORC, YouGov, Marquette, Pew, and Gallup is that support for political violence is no longer confined to tiny extremist fringes, even though it remains a minority position overall.
Fact check: polling data has shown increased support for political violence. 30 years ago 1 in 10/15 Americans would say violence is sometimes justified for political ends but now those numbers are up, some survey estimates them as high as 30% some even as high as 40%
Here’s what I found in fact-checking that claim — the polling evidence does support the idea that more Americans now say political violence is sometimes justified, though the precise numbers depend a lot on how questions are phrased, when the survey was done, and what “political violence” means in context. I’ll lay out what the data shows, where there’s uncertainty, and how that compares to “30 years ago.”
What polling data does show
- Recent large-survey findings
- A longitudinal survey by the University of California Davis Violence Prevention Research Program found in 2022 that about 32.8% of respondents said violence is usually or always justified to advance _at least one_of a set of political objectives. (BioMed Central)
- In that same survey, that number dropped somewhat in 2023 and held roughly stable in 2024 at ≈ 25-26%. (BioMed Central)
- Another poll (from PRRI, 2023) asked whether “true American patriots may have to resort to violence to save our country” and found 23% agreed with that. (PRRI)
- Evidence of increase over recent years
- The same PRRI poll shows that figure has risen: in 2021 the agreement was ~15%, and by 2023 it reached ~23%. That is a substantial uptick over just a couple of years. (PRRI)
- Subgroups vary a lot: Republicans (especially those with favorable views of Trump), those who believe the 2020 election was stolen, etc., show higher levels of agreement. (PRRI)
- What people worry about
- Many polls also indicate that a large majority of Americans are worried about political violence, or believe democracy is under threat. That’s a slightly different question than “do you believe violence is justified.” (Leadership Conference)
What is more uncertain / depends on wording
- The phrasing of questions matters a lot. Asking if “violence is justified” across any political objective vs asking about specific scenarios changes responses. Also asking about “true patriots” or “save the country” is more abstract and may get more agreement than more concrete, morally weighty questions (e.g. “violence against people” or “killing”).
- Surveys often distinguish between justifying violence in principle vs willingness to personally engage in it. The latter is usually much lower. (BioMed Central)
- Comparisons over time are hard: older surveys used different question wording, different samples, etc. So when people say “30 years ago only 10-15%,” that may be a rough estimate but it’s not always a directly comparable baseline.
What about 30+ years ago?
- I did not find solid polling data from ~1990-1995 that directly asked equivalent questions in the same way. So it is hard to say exactly what “10-15%” represented back then under comparable measures.
- Some older surveys in more recent decades (say 2000-2010) show lower levels of overt support for political violence, but exact numbers vary.
Bottom line
- Yes: the claim that more Americans now express some justification for political violence is supported by data. Surveys in recent years show numbers in the 20-35% range, depending on the question.
- The idea of “as high as 30-40%” is plausible for certain subgroups or particular questions (especially when asked in more abstract terms), but not uniformly true across all Americans or under all definitions.
- The “10-15% thirty years ago” is plausible as a general comparison, but I didn’t find a clean, directly comparable survey from that time to confirm that exact baseline.
Here’s a table summarizing what the polling/studies I found say about support for political violence by political affiliation. The numbers vary a lot depending on how the question is asked.
| Survey / Question | Republicans (GOP) | Independents / Non-aligned | Democrats | Notes / Question Wording |
|---|---|---|---|---|
| PRRI / Brookings, Oct 2023 — “Because things have gotten so far off track, true American patriots may have to resort to violence to save the country.” | ~ 33% (PRRI) | ~ 22%(Axios) | ~ 13%(PRRI) | |
| PRRI / American Values Survey, 2024 — same “patriots may have to resort to violence…” question | ~ 29% (PRRI) | ~ 16%(PRRI) | ~ 8%(PRRI) | |
| UC Davis Violence Prevention Research Program (2022-2024) — “Violence usually or always justified to advance at least one of 17 specified political objectives” (“justified” measure) | Republicans more likely than Democrats; MAGA Republicans highest (≈ 58.2%) vs other Republicans ≈ 31.5% vs non-Republicans ≈ 25.1% (PLOS) | — | Democrats / non-Republicans ≈ 25.1% (PLOS) | |
| UC Davis VPRP, 2024 — same “justified to advance at least one objective” overall (regardless of party) | — | — | — | Overall ≈ 26.2% say violence usually or always justified for at least one political objective. Does _not_break out by party in that specific overall number in that report. (PMC) |
Key takeaways / caveats
- Among Republicans, a sizeable minority (roughly 30-35%) believe violence may be justified under certain political conditions (depending on wording). This percentage is much lower among Democrats (often around 10-15% in similar questions).
- Among Independents, the numbers are generally in between Republicans and Democrats, often in the low-20% range for these questions.
- The highest party‐based numbers tend to come from subsets: for example MAGA Republicans had ~ 58% saying violence is “usually or always justified” to advance at least one objective. But that’s a subgroup (MAGA Republicans) rather than all Republicans. (PLOS)
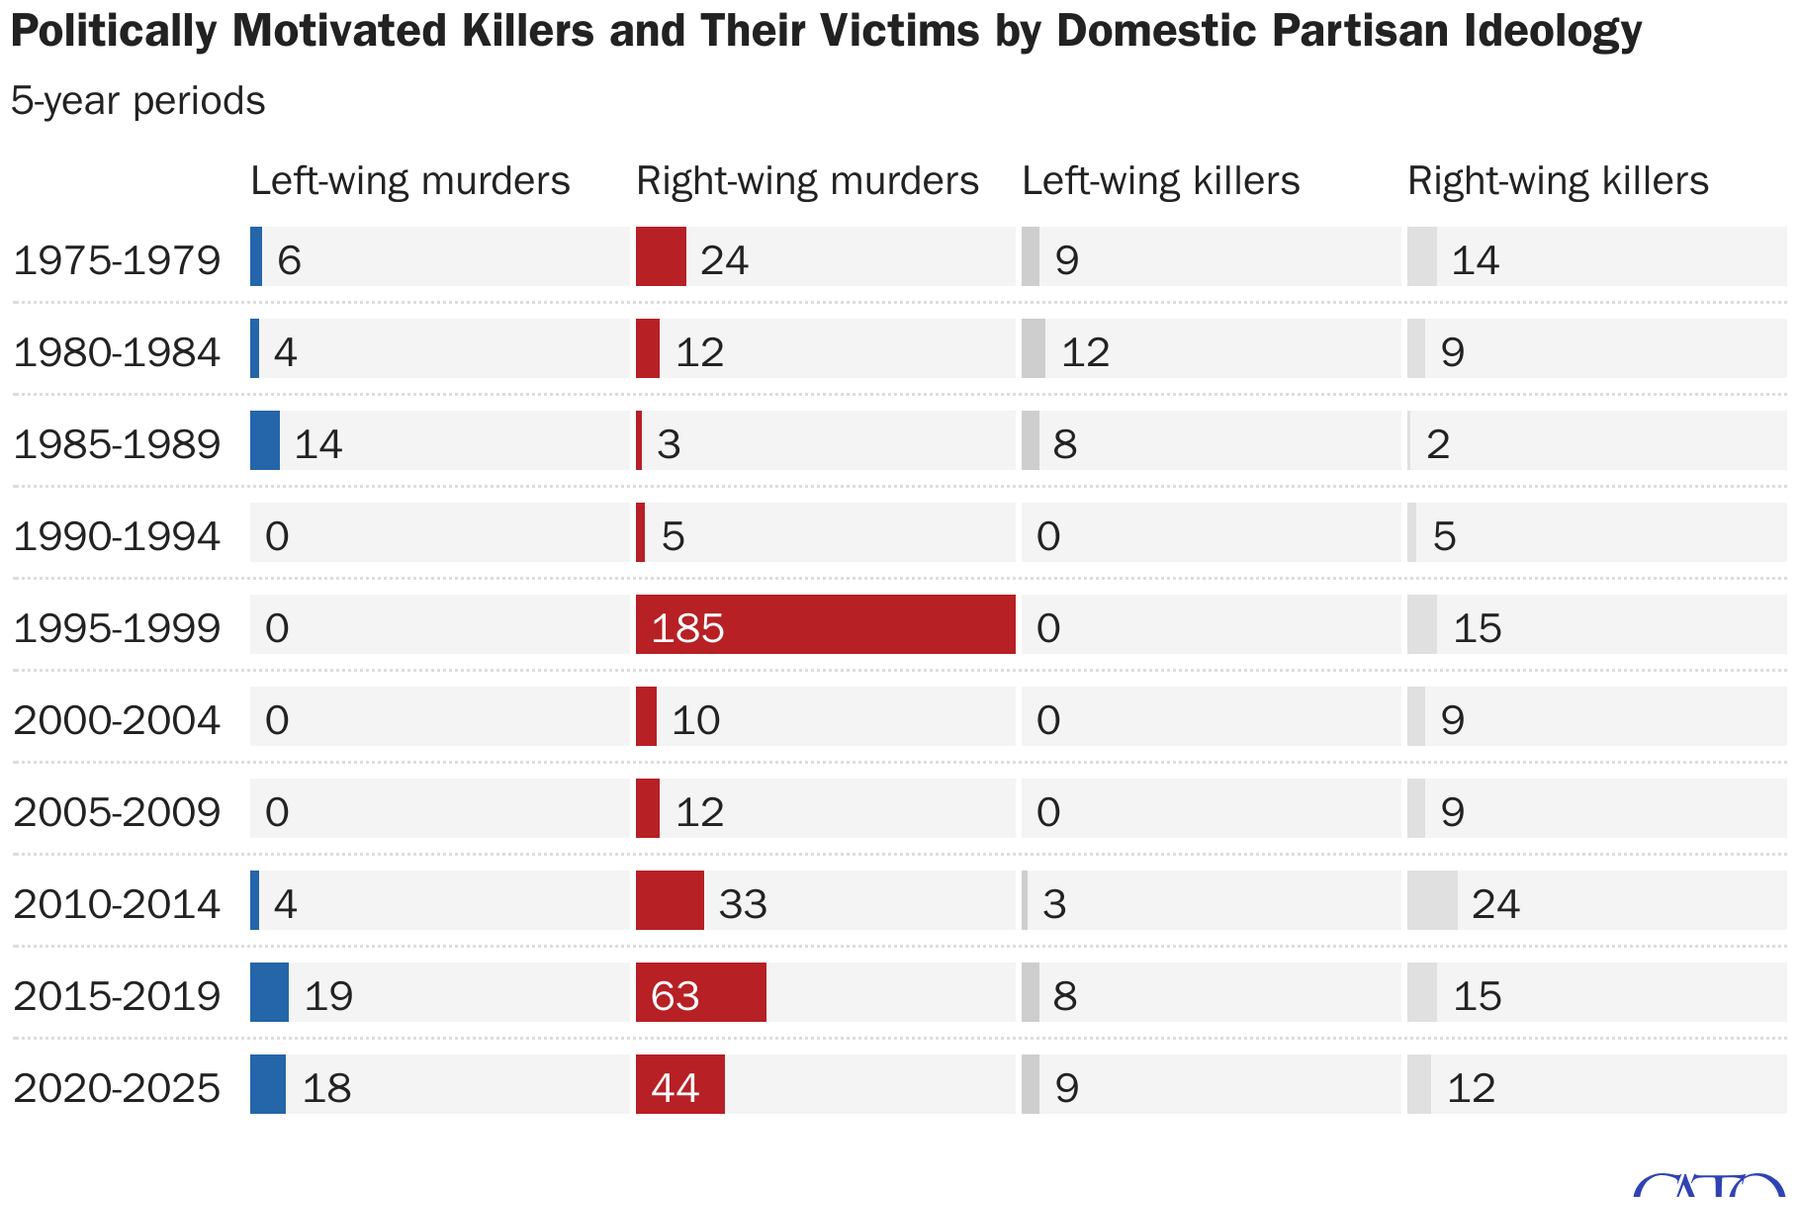
Political Motivated Killers Statistics
Https://www.alexnowrasteh.com/p/deadly politically motivated violence