Filed with Social Issues MOC · Related: 60.5 Parenting · 60.21 Psychology
Pinker’s Chapter 7 supplement — corporal punishment, abuse, and peer violence
Pinker’s longer history moves children from property and labor resources toward rights-bearing people whose pain counts independently. A revealing bridge is the 1874 case of ten-year-old Mary Ellen McCormack: because New York lacked a child-protection law, reformers enlisted the animal-protection movement, used habeas corpus to remove her from an abusive home, and founded what Pinker identifies as the world’s first child-protection society. It is an example of “rights contagion” by analogy, not proof that later reforms had one cause.
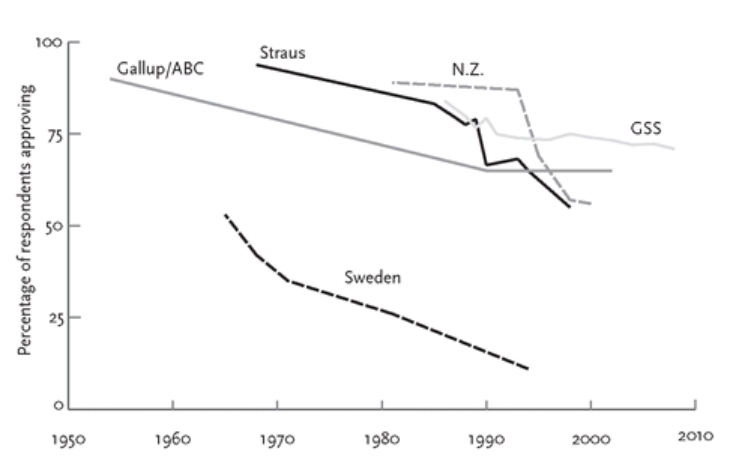
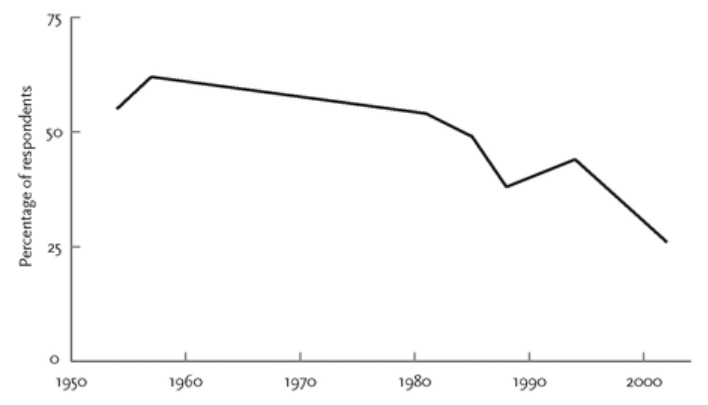
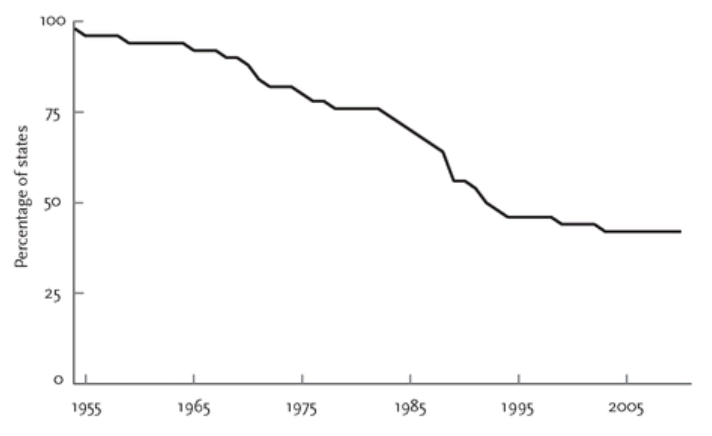
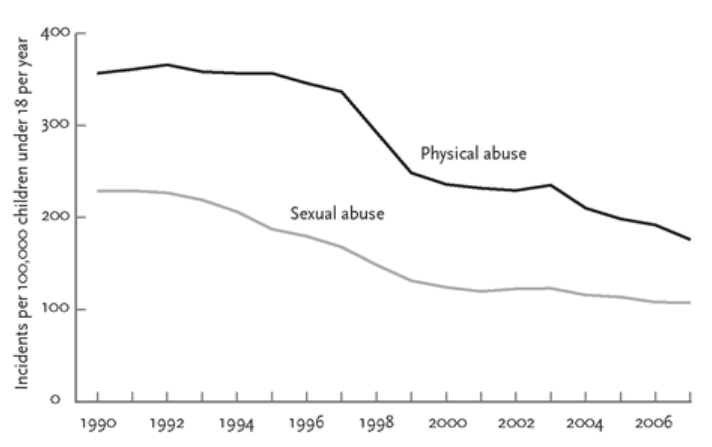
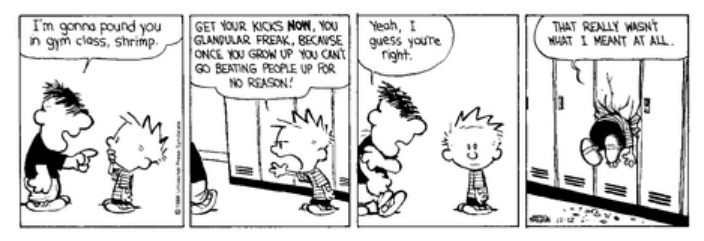
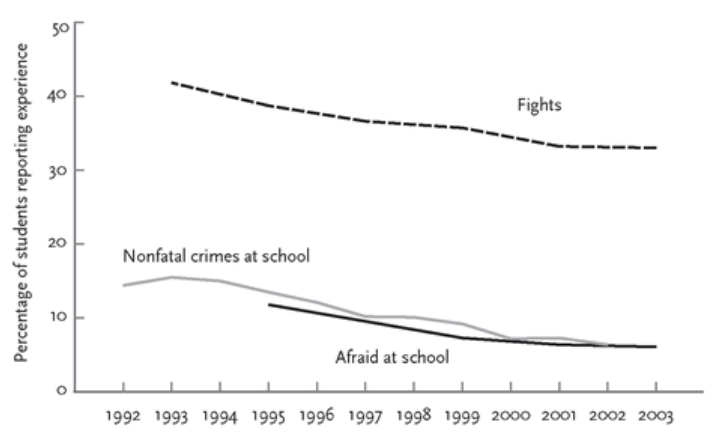
Figures 7-17 to 7-22 — Spanking attitudes, school corporal punishment, substantiated abuse, a bullying cartoon, and school violence, 1954–2008. Approval of spanking declines in every series shown, though levels and question wording differ sharply across countries and U.S. surveys. U.S. approval of school corporal punishment and the share of states allowing it also fall. Pinker notes a state-level correlation of 0.52 between approval of spanking and homicide, but explicitly favors shared regional culture over treating the graph as proof that spanking causes murder. Figure 7-20 uses substantiated agency cases and shows physical abuse falling roughly by half and sexual abuse by about a third from 1990–2007; changing definitions, surveillance, and reporting matter, though Pinker cites victimization, homicide, confession, and disease measures as corroboration. His suggestion that psychiatric medication helped is speculation.
Figure 7-21 is a Calvin and Hobbes cartoon, not quantitative evidence. Figure 7-22 shows declines in fighting, nonfatal school crime, and fear at school from 1992–2003; it does not isolate anti-bullying laws as the cause. Pinker also notes that the Columbine perpetrators were not the bullied Goth victims of the popular media story that energized the movement. All six figures are historical snapshots; the 2011 counts of countries banning corporal punishment and states with anti-bullying laws are not current totals. Chapter 7 synthesis · Attachment (file not included in this release) · Attachment (file not included in this release) · Attachment (file not included in this release) · Attachment (file not included in this release) · Attachment (file not included in this release)
📊 Gender Distribution in Child Maltreatment
- Neglect Cases: The Fourth National Incidence Study of Child Abuse and Neglect (NIS-4) reports that in cases of child neglect, female perpetrators were responsible in 86% of instances.
- Concerning Andrew Wilson debating this point, it begs the question: “Then shouldn’t men be the primary care givers instead of women?” Debate
- Physical Abuse Cases: For physical abuse under the Endangerment Standard, female perpetrators were more often responsible, though the exact percentage isn’t specified in the summary.
- Sexual Abuse Cases: Male perpetrators are more commonly associated with sexual abuse cases.
🧾 Additional Context
- Primary Caregiver Role: Women are more often the primary caregivers, leading to increased scrutiny and reporting of their actions.
- Reporting Bias: Societal expectations and biases may result in higher reporting rates for female caregivers, potentially skewing statistics.
- Underreporting of Male Perpetrators: Male-perpetrated abuse, especially sexual abuse, is often underreported due to stigma and societal perceptions.
📚 Further Reading
For more detailed information, you can refer to the following resources:
- Fourth National Incidence Study of Child Abuse and Neglect (NIS-4) Full Report
- Child Maltreatment 2022 Report
- StatPearls Article on Child Physical Abuse and Neglect
These resources provide comprehensive data and analysis on child maltreatment, including the roles of different perpetrators, types of abuse, and the impact on victims.
Attachment (file not included in this release)
Attachment (file not included in this release)
Perpetrator’s sex. Children were somewhat more likely to be maltreated by female perpetrators than by males: 68% of the maltreated children were maltreated by a female, whereas 48% were maltreated by a male. (Some children were maltreated by both.) Of children maltreated by biological parents, mothers maltreated the majority (75%) whereas fathers maltreated a sizable minority (43%). In contrast, male perpetrators were more common for children maltreated by nonbiological parents or parents’ partners (64%) or by other persons (75%).
Attachment (file not included in this release)
males more often were abusers (62% of children were abused by males versus 41% by females). The prevalence of male perpetrators was strongest in the category of sexual abuse, where 87% of children were abused by a male compared to only 11% by a female.
Attachment (file not included in this release)
Among all abused children, those abused by their biological parents were about equally likely to have been abused by mothers as by fathers (51% and 54%, respectively), but those abused by nonbiological parents or parents’ partners, or by other, perpetrators were much more likely to be abused by males (74% or more by males versus 26% or less by females).
Fourth National Incidence Study of Child Abuse and Neglect (NIS-4)
- conducted in 2005–2006, is a comprehensive federal effort to estimate the incidence of child maltreatment in the U.S. It integrates data from both Child Protective Services (CPS) and community professionals (sentinels) to provide a broader perspective on child abuse and neglect.
🔍 Study Design and Methodology
- Data Collection: Data were gathered from 126 CPS agencies across 122 counties and 10,791 community professionals (sentinels) in 1,094 agencies.(cap.law.harvard.edu)
- Standards Used:
- Harm Standard: Counts cases where maltreatment resulted in demonstrable harm.
- Endangerment Standard: Includes cases where children were at risk of harm, even if no harm occurred.(Office of Justice Programs)
📊 Key Findings
Under the Harm Standard:
- Total Maltreated Children: Approximately 1,256,600 children (1 in 58).(cap.law.harvard.edu)
- Abuse: 553,300 children (44% of maltreatment cases).
- Physical Abuse: 323,000 children.
- Sexual Abuse: 135,300 children.
- Emotional Abuse: 148,500 children.(cap.law.harvard.edu)
- Neglect: 771,700 children (61% of maltreatment cases).
- Physical Neglect: 295,300 children.
- Emotional Neglect: 193,400 children.
- Educational Neglect: 360,500 children.(cap.law.harvard.edu)
Under the Endangerment Standard:
- Total Maltreated Children: Approximately 2,905,800 children (1 in 25).
- Abuse: 835,000 children (29% of maltreatment cases).
- Physical Abuse: 476,600 children.
- Sexual Abuse: 180,500 children.
- Emotional Abuse: 302,600 children.(cap.law.harvard.edu)
- Neglect: 2,251,600 children (77% of maltreatment cases).
- Physical Neglect: 1,192,200 children.
- Emotional Neglect: 1,173,800 children.
- Educational Neglect: 360,500 children.(cap.law.harvard.edu)
📉 Trends Since NIS-3 (1993)
- Decrease in Abuse: Notable declines in physical, sexual, and emotional abuse under both standards.(cap.law.harvard.edu)
- Increase in Emotional Neglect: Significant rise in emotional neglect cases under the Endangerment Standard.
👶 Demographic Insights
- Gender: Girls were more frequently victims of sexual abuse, leading to higher overall abuse rates among females.
- Age: Children aged 0–2 had lower observed rates of maltreatment, possibly due to reduced visibility to professionals.(cap.law.harvard.edu)
- Race/Ethnicity: For the first time, the study found higher maltreatment rates among Black children compared to White and Hispanic children.(NCJFCJ)
- Disability Status: Children with disabilities faced higher rates of emotional neglect and serious harm.(cap.law.harvard.edu)
📚 Accessing the Full Report
For a comprehensive understanding, you can access the full NIS-4 report here:
If you have specific questions or need further details on particular aspects of the report, feel free to ask!
1: https://cap.law.harvard.edu/wp-content/uploads/2015/07/sedlaknis.pdf “[PDF] Fourth National Incidence Study of Child Abuse and Neglect (NIS-4)“
2: https://ojp.gov/ncjrs/virtual-library/abstracts/nis-4-what-it-all-means-and-doesnt-mean “The NIS-4: What It All Means (And Doesn’t Mean)“
3: https://ncjfcj.org/wp-content/uploads/2012/03/nis-4-technical-assistance-brief-1.pdf “[PDF] The NIS-4: What It All Means (and doesn’t mean)”
In the Fourth National Incidence Study of Child Abuse and Neglect (NIS-4), physical neglect is defined as the failure of a parent or caregiver to provide for a child’s basic physical needs, which can result in harm or the risk of harm to the child’s health or development.
Physical Neglect
- Inadequate provision of food, clothing, or shelter
- Lack of necessary medical or dental care
- **Failure to ensure the child’s safety and supervision
📊 Incidence Rates from NIS-4
The NIS-4 provides estimates of physical neglect under two standards:
- Harm Standard: Approximately 295,300 children experienced physical neglect, representing 38% of all neglect cases
- Endangerment Standard: Approximately 1,192,200 children were identified as physically neglected, accounting for 53% of neglect cases .
The Harm Standard requires demonstrable harm to the child, while the Endangerment Standard includes situations where the child was at risk of harm, even if no harm occurred.
🧾 Additional Context
It’s important to note that definitions of neglect can vary across states and agencies. However, the NIS-4 provides a standardized framework for understanding and identifying physical neglect on a national level. This standardization is crucial for developing consistent policies and interventions to protect children from neglect.
Child Maltreatment in the U.S. – 2022 Overview
Attachment (file not included in this release)
National Child Abuse and Neglect Data System (NCANDS)
The Child Maltreatment 2022 report, published by the U.S. Department of Health and Human Services, provides the following statistics:
- Victims: An estimated 558,899 children were victims of abuse and neglect, equating to a rate of 7.7 per 1,000 children.(cwla.org)
- Types of Maltreatment:
- Neglect: Accounted for 76% of cases.
- Physical Abuse: Comprised 16% of cases.
- Sexual Abuse: Represented 10% of cases.(Child Welfare Information Gateway)
- Fatalities: There were 1,990 child fatalities due to abuse or neglect, a 12.7% increase since 2018. (Child Welfare Monitor)
- Perpetrators:
- Parents: Responsible in 76% of cases.
- Gender: Over 50% of perpetrators were female. (Mandated Reporter)
- Reporting Sources:
- Professionals: Submitted 70% of reports, including educators (20.7%), law enforcement (21.2%), and medical personnel (11.2%).
- Nonprofessionals: Accounted for 15.2% of reports. (cwla.org)
For a comprehensive breakdown, you can access the full report here:
- https://acf.gov/sites/default/files/documents/cb/cm2022.pdf
Attachment (file not included in this release)
Based on data from 50 reporting states, slightly more than one-half (51.1%) of perpetrators are female and 47.7 percent of perpetrators are male; 1.1 percent of perpetrators are of unknown sex.
Attachment (file not included in this release)
The majority (76.0%) of perpetrators are a parent of their victim, 7.0 percent of perpetrators are a relative other than a parent, 4.2 percent are an unmarried partner of the parent, and 4.1 percent have multiple relationships to their victims.
National Survey of Children’s Exposure to Violence (NatSCEV)**
The NatSCEV series offers insights into children’s exposure to various forms of violence:
- Physical Assault: In 2014, 37.3% of youth experienced a physical assault within the year.(PubMed)
- Sexual Abuse: Approximately 2% of girls experienced sexual assault or abuse in the same period.(PubMed)
- Caregiver Maltreatment: About 15.2% of children and youth experienced maltreatment by a caregiver, including 5.0% who experienced physical abuse. ([PubMed][5])
For more details on the NatSCEV series, visit: - National Survey of Children’s Exposure to Violence (NatSCEV) Series
If you need further information or assistance with specific aspects of these reports, feel free to ask!
1: https://www.cwla.org/child-maltreatment-report-2022/ “Child Maltreatment Report 2022 – CWLA”
2: https://www.childwelfare.gov/ “Child Welfare Information Gateway”
3: https://childwelfaremonitor.org/2024/02/06/child-maltreatment-2022-reports-increase-but-response-lags/ “Child Maltreatment 2022: reports increase but response lags”
4: https://mandatedreporter.com/blog/the-state-of-child-abuse-in-2022/ “The State of Child Abuse in 2024 - Mandated Reporter”
[5]: https://pubmed.ncbi.nlm.nih.gov/26121291/ “Prevalence of Childhood Exposure to Violence, Crime, and Abuse”