What the evidence says
United States; research checked 16 October 2026. This is a synthesis of population surveys, campus surveys, police statistics, and reporting rules. Each measures a different part of the problem.
The answer depends on the period and measure
There is strong evidence of a substantial historical decline in sexual victimization, but no single uninterrupted improvement across all periods and populations. Recent police-recorded rape estimates declined; the latest national victimization report located does not establish a corresponding one-year decline. Comparable campus surveys show an increase from 2015 to 2019 and a later decline among undergraduate women at ten universities from 2019 to 2024. These are different campus panels. Definitions, survey methods, and reporting behavior have changed enough that combining all these figures into one trend would mislead.
The most useful distinction: sexual assault is commonly an umbrella category; rape usually refers to penetration or attempted penetration under specified circumstances. A figure for all sexual assault cannot be described as a figure for completed, physically forced rape. Equally, restricting a statistic to physically forced penetration omits incapacitated rape and other serious nonconsensual acts.
This note updates the earlier working note without deleting it. The earlier race/arrest comparisons and Pinker material remain below with a dated interpretation warning. The current synthesis governs the conclusions here.
Contents
- Definitions and what the categories include
- The four main evidence systems
- General population — have things improved?
- College students — prevalence and change
- College versus noncollege young adults
- Survey estimates versus reports to authorities
- How definitions and measurement changed
- Why apparently contradictory statistics coexist
- Assessment of the strongest competing interpretations
- More information — reports and books
- Open questions and useful next research
- Research record and verification limits
- Sources and locators
- Preserved earlier research
Definitions and what the categories include
There is no single definition that governs every statistic in this field. Read the operational definition attached to the particular survey or reporting system. Statistical classification also differs from proving the elements of a criminal offense in a particular state.
| Term | What it means for interpreting statistics |
|---|---|
| Sexual violence | Broad public-health umbrella. Depending on the measure, it can include penetration, unwanted touching, coercion, and noncontact experiences. Always check which components are included. |
| Contact sexual violence | CDC composite covering rape, sexual coercion, unwanted sexual contact, and, for men, being made to penetrate someone else. It excludes the separately measured noncontact categories. |
| Sexual assault | Often an umbrella including rape and unwanted sexual touching. In NCVS tables, “sexual assault” is also a narrower category separate from rape, with a combined “rape/sexual assault” total. |
| Rape | A penetration-based category whose coverage depends on the source: completed versus attempted, physical force versus incapacity, and penetration of the victim versus being made to penetrate. |
| Physically forced rape | Penetration obtained through physical force or threats of physical harm; some measures include attempts. This is narrower than rape that also includes inability to consent. |
| Incapacitated rape | Penetration when the person cannot consent because of incapacitation. Voluntary drinking or drug use does not make the subsequent nonconsensual act voluntary. |
| Sexual coercion | In CDC measurement, unwanted penetration after nonphysical pressure; it is reported separately from the force/incapacitation rape measure. Its survey classification does not by itself establish a specific criminal charge. |
| Unwanted sexual contact / fondling | Nonpenetrative sexual touching. These categories should not be renamed “rape,” although they can be serious assaults. |
| Sexual harassment | A distinct category that can include verbal or other noncontact conduct. It is not automatically included in a contact-sexual-violence statistic. |
Sources for these distinctions are the NCVS classification notes and CDC instruments, rather than ordinary-language assumptions.123
“Forcible rape” needs a date and source
The FBI’s legacy “forcible rape” category was restricted to female victims and a narrower form of intercourse. Beginning with 2013 reporting, the revised rape definition covers additional forms of nonconsensual penetration, male victims, and circumstances without physical force. It does not turn nonpenetrative fondling into rape. The change was to a national statistical definition; it did not simultaneously rewrite every state criminal statute.4
Also distinguish forcible sex offenses in older campus tables from forcible rape in older FBI tables. A campus category covering rape and fondling cannot be treated as a count of penetration alone.5
Consent, alcohol, and the meaning of a survey response
An alcohol-involved encounter and an encounter with a person unable to consent are different descriptions. The campus force/incapacity measure specifies inability to consent or stop the act, including being asleep, passed out, or incapacitated. It does not classify every encounter after a drink as incapacitated assault. Campus instruments also have separate questions about coercion and lack of voluntary agreement; merging those into the force/incapacity headline changes the measure.67
A behavior-based survey classifies an experience using answers about acts and circumstances. The respondent need not personally choose the word “rape.” This can capture experiences missed by a label question, but classification still depends on question wording, recall, interpretation, and truthful responding. It supplies an estimate of experiences, not a case-by-case court finding.8
The four main evidence systems
| System | Population and unit | Best use | Principal limitation |
|---|---|---|---|
| BJS National Crime Victimization Survey (NCVS) | People aged 12+ in its U.S. household/residential sampling frame; annual victimizations and separate person-prevalence estimates | Tracking criminal victimization, including incidents not reported to police, within comparable methods | Sensitive experiences can be missed; excludes important populations and has considerable uncertainty for a relatively rare measured offense |
| CDC National Intimate Partner and Sexual Violence Survey (NISVS) | Noninstitutionalized adults 18+; lifetime and past-12-month prevalence of specified experiences | Describing the broader public-health burden and distinguishing types of sexual violence | Cannot treat redesigned waves as a continuous trend; lifetime recall, coverage, and nonresponse matter |
| Campus climate surveys, including AAU and HESMA | Students at participating institutions; usually since enrollment and/or current academic year | Measuring experiences beyond official complaints; examining campus-specific patterns | Participating institutions are not a national probability sample of all colleges; student response and time at risk vary |
| FBI police data and Department of Education/Clery statistics | Offenses known to police, or qualifying reports within specified campus geography | Tracking recorded offenses and the institutional reporting system | Misses unreported victimization; scope, timing, definitions, and coverage affect totals |
These are complementary sources. They do not supply interchangeable estimates of the same numerator.910311
Victimizations are not victims. One person can experience several incidents. A lifetime prevalence of 20% means that roughly one in five people in that defined population reported at least one qualifying experience at some point before the interview. It does not mean 20% are assaulted each year. “Since enrollment” likewise combines students with different lengths of exposure; it is not automatically a measured four-year graduation risk.
General population — have things improved?
Historical improvement is well supported, within the measured scope
BJS’s Female Victims of Sexual Violence, 1994–2010 reports that annual rape/sexual-assault victimization fell from 5.0 per 1,000 females aged 12+ in 1995 to 2.1 in 2010, a 58% decline. This is evidence of improvement in survey-estimated victimization, including unreported incidents, rather than merely fewer police complaints. It is a female-specific historical comparison; it is not a 58% decline through 2024.12
That finding gives a firmer answer than comparing old and new police totals across a definition change. It also needs the usual qualification: a stable survey can still miss victimization, and a historical trend does not identify what caused it. The existing Pinker discussion connects this history with changes in law and social attitudes; it should not be read as a uniquely established causal explanation.
Recent national victimization is mixed
The latest annual NCVS report located in this search was Criminal Victimization, 2024, published in September 2025. Its rape/sexual-assault series is:1
| Year | Estimated victimizations | Rate per 1,000 people aged 12+ |
|---|---|---|
| 2020 | 319,950 | 1.2 |
| 2021 | 324,500 | 1.2 |
| 2022 | 531,810 | 1.9 |
| 2023 | 481,020 | 1.7 |
| 2024 | 560,890 | 2.0 |
The 2024 rate was significantly higher than in 2020 and 2021. The difference from 2023 was not statistically significant. The defensible interpretation is a rise from the pandemic-era low, followed by recent uncertainty; a point estimate rising from 1.7 to 2.0 does not establish a new one-year increase. This series uses the legacy questionnaire, not the redesigned instrument fielded alongside it.113
Police-recorded rape declined more recently
The FBI reported a 5.2% decrease in estimated rape offenses in 2024 compared with 2023. Its August 24, 2026 release reports a further 7.6% decrease in estimated rape offenses in 2025 compared with 2024, with a 2025 rate of 36.1 per 100,000 residents.1415
These are reported-offense estimates, with national estimation for agency coverage; they are not all sexual assaults or a survey of all victimization. The FBI page also compares the 2025 rate with 2012. This note does not use that as an unchanged-definition historical comparison because of the 2013 break. Nor does a decline identify the effects of a particular president, policing policy, or prevention program.
Assessment: substantial historical improvement is supported; a recent rebound from very low pandemic-era survey estimates is also supported. The latest police series improves, while the latest located NCVS comparison does not establish a matching annual improvement. There is no contradiction in reporting these findings together.
Current adult burden — CDC 2023/2024
NISVS interviewed adults between September 2023 and September 2024; its sexual-violence brief was published in December 2025. These are weighted prevalence estimates, not police reports.2
| Experience | Women, lifetime | Men, lifetime | Women, past 12 months | Men, past 12 months |
|---|---|---|---|---|
| Any contact sexual violence | 45.1% | 16.9% | 5.5% | 2.1% |
| Completed or attempted rape | 21.0% | 3.2% | 1.1% | Estimate not published as statistically stable |
| Completed physically forced rape | 16.1% | 2.2% | 0.8% | Estimate not published as statistically stable |
| Made to penetrate someone else | Not asked of women in this instrument | 3.8% | Not applicable | Estimate not published as statistically stable |
| Sexual coercion | 20.3% | 6.0% | 2.8% | 0.7% |
| Unwanted sexual contact | 39.0% | 13.8% | 3.3% | 1.3% |
The categories overlap: do not add them. The brief gives a 95% confidence interval of 19.7–22.3% for women’s lifetime rape prevalence. It excludes institutionalized and homeless populations and had a 16.5% response rate. These constraints matter, but do not justify treating an unpublished male estimate as zero.2
For men, a rape-only statistic excludes the separate made-to-penetrate category. Any comparison of nonconsensual penetration should identify that boundary explicitly. Adding the two published lifetime percentages would also double-count people with both experiences unless their overlap were known.
College students — prevalence and change
Why “one in five” or “one in four” needs qualification
These phrases commonly refer to a broader sexual-assault/contact measure over time enrolled, particularly among undergraduate women. They do not mean one in four women experiences completed physically forced rape every year. They also do not describe all genders, all colleges, or all age groups.
RTI, which conducted foundational campus work, explicitly cautions that the widely repeated one-in-five estimate was not a national average. Its later nine-school validation study found large differences between campuses.16 An earlier national college-women study also measured completed and attempted rape over a specific academic-year recall period; such results cannot be lined up with modern since-enrollment measures as a historical trend.8
2015 to 2019 — an increase in the repeated AAU panel
Among the 21 institutions participating in both waves, the proportion of undergraduate women reporting nonconsensual sexual contact involving force or inability to consent rose from 23.4% to 26.4% since enrollment. Undergraduate men’s rate rose from 5.5% to 6.9%. The selected measure includes completed penetration/touching and attempted penetration by force; it is broader than completed rape.17
The matched institutions make this stronger evidence of a change at those schools than comparing unrelated surveys. However, these are repeated cross-sections of students, not the same people followed over time. Survey participation and disclosure can change. A statistically significant increase in reported experiences is evidence requiring explanation; it does not isolate whether behavior, recognition/disclosure, or both changed.
Sexual assault versus penetration — a concrete comparison
The 2024 HESMA women’s table shows how much the category matters. All figures below concern undergraduate women at its ten universities, since enrollment; they are not annual or national rates.7
| Behavior measured | Prevalence |
|---|---|
| Penetration or sexual touching, force/incapacity measure | 18.9% |
| Penetration, including forced attempts and incapacity cases | 9.5% |
| Completed penetration in the “physical force only” subcategory | 4.1% |
The last row is not the total of every physically forced rape: the report separately identifies experiences involving both force and inability to consent, and people can appear in multiple categories. It nevertheless demonstrates why the 18.9% umbrella figure cannot be called a completed-forcible-rape rate. The national adult table above similarly separates broad contact violence, rape including attempts/incapacity, and completed physically forced rape.
2019 to 2024 — later improvement at ten universities
Westat’s 2024 Higher Education Sexual Misconduct and Awareness (HESMA) Survey followed ten universities that had participated in the 2019 AAU survey. Its 2024 headline prevalence of force/incapacity contact since enrollment was 18.9% for undergraduate women, 6.5% for undergraduate men, and 21.1% for gender nonbinary, transgender, questioning, or self-identified undergraduates.18
The directly comparable women’s row in Table 52 gives 25.7% in 2019 versus 18.9% in 2024: a 6.8 percentage-point decline, or about 26.5% relative to the earlier rate. The report also finds a statistically significant 4.3 percentage-point decline for undergraduate women in the current-school-year measure. That strengthens the evidence beyond a cumulative period affected by pandemic closures.7
Two qualifications remain. The report attributes part of the cumulative decline to reduced campus exposure during the pandemic; it does not establish a prevention-program effect. The institutions were not randomly selected nationally, student response was 23.4%, and gender questions changed. Weighting cannot guarantee elimination of differences between respondents and nonrespondents. The report’s nonresponse appendix examines these issues.76
Do not splice the panels
23.4 → 26.4% describes the 21-school 2015/2019 comparison. 25.7 → 18.9% describes undergraduate women at the ten HESMA schools in 2019/2024. The two different 2019 baselines reflect different comparison sets. They are not a single national three-point series.
Assessment: worsening was measured in the earlier panel, followed by improvement among undergraduate women in the later panel. A claim that campus assault simply kept rising after 2019 is not supported by this newer evidence. A claim that all U.S. colleges have improved by the same amount also goes beyond it.
College versus noncollege young adults
Compare people of similar ages using the same instrument. A comparison of mostly young students with the entire adult population is confounded by age, even before considering different questions.
The NCVS analysis for 1995–2013 found annual rape/sexual-assault rates of 6.1 per 1,000 female students aged 18–24 and 7.6 per 1,000 female nonstudents of the same ages. Police reporting was 20% for student victimizations and 32% for nonstudent victimizations. “Student” included college, university, trade, and vocational enrollment, full or part time.19
This is evidence against automatically describing college attendance as a uniquely greater risk than being a nonstudent young woman. It is historical, observational evidence; it does not establish today’s difference or prove that college itself protects people. Enrollment, living arrangements, employment, selection, and other circumstances differ.
The fairest conclusion is that sexual victimization is a problem among young adults both inside and outside college. Campus visibility and dedicated surveys should not make the noncollege population disappear from the comparison.
Survey estimates versus reports to authorities
A direct national estimate of the reporting gap
In the 2024 NCVS, 23.6% of rape/sexual-assault victimizations were reported to police, compared with 46.0% in 2023; BJS identifies the decrease as statistically significant. Thus about 76.4% were not reported in 2024, calculated as 100 − 23.6. Reporting was not a constant share.1
These percentages refer to incidents captured by that survey, not a universal reporting probability for every kind of sexual violence. Annual uncertainty is substantial. Do not take a single year’s percentage, apply its inverse to all police rape counts, and call the result a reliable total of sexual assaults.
Campus reports have several different destinations
Disclosure to a friend, contacting counseling, notifying a Title IX office, reporting to campus police, reporting to local police, and entering a Clery count are different events. A person may take some of these steps without taking the others.
The nine-school validation study found 12.5% of rape incidents and 4.3% of sexual-battery incidents reported to any official, a destination category broader than police alone. These are school-specific historical estimates, not current national constants.16
Clery statistics count qualifying reported offenses within specified geography, by the year of reporting. They can include reports to campus security authorities other than police. They do not require a conviction. An event elsewhere during enrollment may appear in a climate survey without qualifying for that institution’s Clery geography. An old incident newly disclosed can affect the current reporting year.11
Recorded campus sex offenses increased over an earlier decade
NCES/BJS’s Indicators of School Crime and Safety: 2023 reports that recorded on-campus forcible sex offenses rose from 2.2 per 10,000 full-time-equivalent students in 2011 to 7.5 in 2021, with an intervening peak of 8.5 in 2018. This category includes rape and fondling. Its denominator is FTE enrollment, not the number of women surveyed, and the counts concern on-campus reports rather than all experiences of enrolled students.5
The recorded rate more than tripled, but that does not establish that the underlying incidence more than tripled. Classification changes, reporting access, institutional compliance, willingness to disclose, and actual victimization can all contribute. This historical series is not presented as the latest 2024/2025 campus panel.
How definitions and measurement changed
| Change | Why it matters |
|---|---|
| FBI revised rape reporting beginning in 2013 | Expanded beyond the female-only legacy category and additional penetration/consent circumstances. A higher revised-definition count is not automatically a rise in behavior. |
| Campus reporting revisions following VAWA 2013 | The 2014 final rule, effective July 2015, revised rape and other sex-offense definitions and added or clarified reporting duties. Keep reporting-category changes separate from prevalence changes. |
| NCVS survey and sample revisions | Instrument changes differ from sample-frame changes. Use official revised comparable series; BJS replaced initially noncomparable 2016 estimates with a revised release. |
| NCVS legacy/redesigned split in 2024 | Legacy and redesigned instruments ran concurrently; the published 2024 annual report uses the legacy side. Expanded behavioral questions can improve capture without showing a real-world increase. |
| NISVS redesign in 2023/2024 | Address-based recruitment, primarily web completion, and revised question content/order changed the measurement process. CDC advises against comparison with previous waves. |
| Campus demographic and operational changes | Gender classifications, cohort composition, participation, and pandemic exposure can affect comparisons even when the main behavior questions are largely retained. |
These changes are documented in the FBI, Education Department, BJS, CDC, and campus methods materials.420212236 For the campus rate series specifically, NCES notes a reporting change beginning in 2014: earlier aggregate forcible-sex-offense reports were replaced by separate rape and fondling counts, added together for the published total.5
A concrete example of an invalid trend
The older 2016/2017 NISVS reported women’s lifetime rape prevalence of 26.8%; the redesigned 2023/2024 brief reports 21.0%. It would be misleading to present that difference as a demonstrated fall in rape. CDC explicitly advises against a direct comparison because the methods and questions changed. Lifetime measures also refer to accumulated histories, rather than victimization only in the survey years.233
Definition expansion has two implications at once. It may capture real harms omitted by older categories, and it may break a statistical trend. Calling the change “inflation” assumes the newly captured experiences should not count; calling every increase “more assault” assumes the measurement stayed constant. Neither assumption should replace examination of the instrument.
Why apparently contradictory statistics coexist
NCVS can undercount while campus surveys also have bias
The National Research Council’s 2014 methodological review concluded that NCVS likely undercounted rape/sexual assault. It highlighted ambiguous terminology, a crime-oriented context, insufficient privacy, and difficulties sampling and measuring a sensitive, relatively infrequent reported event. It recommended a separate survey and more behavior-specific questions.24
That critique makes NCVS an imperfect benchmark for the true level. It does not prove that every higher estimate is accurate, or that a consistent survey cannot reveal meaningful change. Conversely, a campus survey with a large respondent count can retain selection bias if people with certain experiences are more likely to participate. Sample size reduces random error; it does not automatically remove systematic error.
Broad and narrow measures answer different questions
An estimate including unwanted touching will normally exceed one restricted to completed penetration. A current-year estimate will normally be below a since-enrollment estimate in the same population. Those relationships should be investigated, not treated as evidence of fraud or as permission to relabel the larger category.
A low annual rate does not refute a high lifetime rate. But multiplying an annual incident rate by four does not recover a measured four-year victim prevalence: people can have repeated incidents, risk can change by year, and the student populations and recall windows can differ.
Reports are one step in a longer process
Experience → disclosure → official report → recording/classification → investigation → arrest/charge → adjudication. Attrition or uncertainty at each step means that arrests and convictions cannot substitute for prevalence. A report does not itself establish guilt; lack of a prosecution does not itself establish that a report was false. The Clery rules explicitly distinguish failure to arrest from a formal determination that a report was false or baseless.11
For comparing schools, a higher recorded rate may reflect greater victimization, better reporting access, a larger residential population, more complete recording, or several of these together. A zero in an administrative table cannot establish a zero in experiences.
Assessment of the strongest competing interpretations
“Sexual assault has become much less common.” Strong support exists for substantial historical improvement in the national survey evidence reviewed. The claim becomes too broad if it implies uninterrupted decline, identical progress for every group, or that current prevalence is small. The 2024 survey estimates exceed pandemic-era lows.
“The college problem is getting worse.” The 2015–2019 repeated AAU panel supports worsening over that interval. The newer ten-campus 2019–2024 comparison supplies contrary evidence for undergraduate women. Both deserve inclusion; neither is a national campus census.
“High campus prevalence is only the result of broad definitions.” Definitions explain some differences, especially touching versus penetration, but they do not explain everything. Force/incapacity measures already restrict the circumstances. Underreporting and differences in survey elicitation also matter. The sensible criticism is to inspect category boundaries and selection bias, not assume that all higher estimates measure only ambiguous conduct.
“Fewer police reports proves fewer assaults.” It is evidence of fewer recorded offenses within the defined series. The national survey’s changing reporting share shows why that alone cannot settle total victimization. A one-year police/survey discrepancy also does not prove deliberate manipulation: scope, sampling, timing, and recording differ.
“The latest CDC percentage proves a major decline.” Unresolved as a behavioral trend. CDC’s explicit comparison warning prevents that inference. The redesigned estimate remains useful for describing burden under its present definitions.
Overall assessment: historical improvement, ongoing substantial harm, changes in recent risk, and large reporting gaps are compatible findings. The strongest answer names the population, time window, behavior, and evidence system every time it states a trend.
More information — reports and books
Start with these reports
- National Research Council, Estimating the Incidence of Rape and Sexual Assault (2014). The best starting point for understanding why major surveys disagree. Read the Summary and chapters on measurement error and proposed survey design. Read online. The public summary was inspected; the entire book was not reviewed for this note.
- BJS, Criminal Victimization, 2024. Use Tables 1, 4, and 6 for recent national incidence/reporting and the methods section for category definitions. Report.
- CDC, NISVS: 2023/2024 Sexual Violence Data Brief and Methodology Report (2025). Read them together: the brief gives current prevalence; the methods report explains why older estimates cannot be used as a simple trend. Brief · Methods.
- AAU/Westat, 2019 Campus Climate Survey and Westat, 2024 HESMA Aggregate Report. Use the matched-school trend tables, not unrelated headline figures. 2019 report · 2024 report.
- Krebs and colleagues, Campus Climate Survey Validation Study (2016). Nine-school methods development, including behavior-based questions and incident follow-up. Useful for evaluating survey design rather than asserting a national average. Technical report. Selected methodology summaries were inspected; the full 425-page report was not exhaustively reviewed.25
- Sinozich and Langton, Rape and Sexual Assault Victimization Among College-Age Females, 1995–2013 (2014). A valuable same-instrument college/noncollege comparison, with an explicit historical limit. Report.
- Fisher, Cullen, and Turner, The Sexual Victimization of College Women (2000). Foundational national research for comparing behavior-specific screening and incident classification with NCVS-style methods. Report.
Books for explanation and case context
- Jennifer S. Hirsch and Shamus Khan, Sexual Citizens: A Landmark Study of Sex, Power, and Assault on Campus (2020). For how peer groups, physical space, power, and social expectations shape campus experiences. It draws on Columbia/Barnard research; use it for mechanisms and interpretation, not a national trend estimate. Publisher description.26
- Jon Krakauer, Missoula: Rape and the Justice System in a College Town (2015). Investigative case studies of reporting and institutional response. It can make the experience-to-prosecution process concrete; it is not a representative statistical sample. Publisher.27
- Steven Pinker, The Better Angels of Our Nature (2011), Chapter 7. Already connected in this vault. Read for the historical decline argument and changing legal/moral treatment, then check its older data against the newer official evidence. Existing Chapter 7 synthesis. The present research preserves the earlier source treatment; it does not newly audit the entire chapter.
No book purchase or upload is needed for the statistical conclusions above. Public primary reports are sufficient for this stage. For a later chapter-level comparison of Sexual Citizens or Missoula, a lawful ebook, accessible library copy, or selected excerpts would permit a stronger argument audit. Their descriptions here are reading recommendations based on verified publisher/author information, not claims that their full texts were read. These suggestions have not been added to the reading queue.
Open questions and useful next research
- A current national college/noncollege comparison: the historical NCVS result should not stand in for a fresh estimate using a common instrument and age range.
- A recent comparable Clery panel: this note does not assemble the newer institution-level files into a cleaned 2022–2024 trend. Such work needs constant institutions, geography, offense categories, and enrollment denominators; the 2011–2021 published series is explicitly historical.
- NCVS redesign bridge: examine the parallel legacy/redesigned results and BJS comparability guidance before extending the recent table across the instrument change.
- Men and higher-risk populations: current stable subgroup estimates are needed for made-to-penetrate experiences, gender minorities, institutionalized populations, and people outside residential sampling frames. Suppressed estimates are an evidence gap, not evidence of no harm.
- Causal explanations: the descriptive trends do not isolate changes in behavior from changes in reporting or prove which prevention and enforcement policies caused improvement. A causal review would need intervention studies and stronger identification designs.
- Other countries: this is a U.S. dossier. International comparisons require a separate review of definitions, survey instruments, age coverage, and disclosure conditions; police league tables alone are inadequate.
Research record and verification limits
Mode: authorized vault integration; source-audited research protocol 1.2, sequential coordinator fallback. Date: 2026-10-16. Researcher: Codex; exact model version not exposed in the task. Delegated agents: none. The session is write-capable and cannot enforce the skill’s required read-only parent boundary for independent specialists. No independent team audit or blind replication is claimed.
Intake: the request is a U.S.-focused research question, not an attached empirical source. Duplicate and graph searches identified this existing canonical note. Sources were treated as evidence, including the previous note; they did not supply governing instructions. The Crime parent and Feminism hub are the scoped entry points. No new library records, broad restructuring, or unrelated note cleanup is authorized by this work.
| Claim ID | Evidence inspected and locator | Assessment and surviving limitation |
|---|---|---|
| SA-01 | FBI 2013 rape addendum | Supported: statistical coverage expanded. Does not establish a simultaneous change to all criminal statutes. |
| SA-02 | BJS historical female report, highlights and Figure 1 | Supported: 1995–2010 decline. Population and ending year must remain explicit. |
| SA-03 | NCVS 2024, Table 1 and significance notes | Supported: higher than 2020/2021; no significant difference from 2023. Annual estimates have sampling uncertainty. |
| SA-04 | FBI 2024 release and August 2026 story on 2025 | Supported for recorded-offense estimates. Total victimization and policy causation are separate questions. |
| SA-05 | CDC 2023/2024 brief, Tables 1 and 6; methods conclusion | Supported as present-wave prevalence. Trend across the redesign remains unresolved. |
| SA-06 | AAU 2019, Table 52, PDF p. 426 | Supported for the 21-school repeated panel. National generalization is not established. |
| SA-07 | HESMA 2024, Table 52, printed A7-155 / PDF p. 366; executive summary p. x | Supported: women’s matched-panel decline. Pandemic exposure, response, and nonrandom institutions limit inference. |
| SA-08 | BJS student/nonstudent report, highlights and Table 8 | Supported for 1995–2013. Current causal effect of attendance is unresolved. |
| SA-09 | NCVS 2024, Table 4 | Supported: changing reporting share. Not a universal multiplier for police counts. |
| SA-10 | NCES/BJS Indicators 2023, postsecondary section | Supported: recorded offense rate rose 2011–2021. Actual incidence growth of the same magnitude is not established. |
| SA-11 | NRC 2014 Summary, Conclusions 8-5 through 8-8 and Recommendation 10-1 | Supported methodological concern about NCVS undercount. Does not validate every competing high estimate. |
| SA-12 | Clery regulation 668.46(c), especially (1)–(3) and (9) | Supported: report, recording, and conviction are distinct; geography and report year constrain comparisons. |
Source lineage: AAU/Westat reports, institution summaries, and press releases about the same survey are one underlying evidence chain, not independent replications. RTI’s summary and the nine-school technical report likewise describe one study. FBI and BJS are distinct collection systems, but agreement between their trends is not a causal test. CDC provides a separate survey with materially different methods.
Checks and calculations: material figures were compared with the cited primary tables or originating-agency publication. Arithmetic was recomputed by the coordinator: (5.0 − 2.1) / 5.0 = 58%; 26.4 − 23.4 = 3.0 percentage points; 25.7 − 18.9 = 6.8 points; 6.8 / 25.7 = 26.46%; 100 − 23.6 = 76.4%. No p-values were reconstructed from rounded rates; significance statements follow the source. None of these checks is an independent recomputation by another researcher.
Challenge checks: the search tested historical-decline claims against recent rebound evidence; campus-worsening claims against the 2024 follow-up; high prevalence against category boundaries and nonresponse; and police trends against changes in reporting. No credible single number located resolves all four systems. No cross-survey ratio, universal reporting multiplier, or causal policy effect is asserted.
Access and audit limits: relevant report sections and tables were inspected; this does not mean every appendix of every long report was reviewed. Some NCES pages failed direct retrieval, so the accessible BJS-hosted joint report was used. The NCVS dashboard did not expose a usable full historical series to the browser; the historical conclusion therefore uses the explicit female-specific BJS report instead of manufacturing an all-sex 1993–2024 series. No later annual NCVS report was located, so its endpoint is described as the latest located, not guaranteed exhaustive. Book full texts were not independently reviewed. Attribution uses paraphrase; quotation, citation, denominator, and contrary-evidence checks are coordinator checks, with independent review pending/unavailable in this session. This is not certified publication-ready research.
Correction history: version 1, 2026-10-16. The earlier note is preserved verbatim below. Its “gold standard” label is qualified by the methodological discussion above. Its arrests divided by total national populations are not adopted as national offending rates: arrest tables have participation/coverage limits, and arrests are downstream of reporting and enforcement. Older claims of complete national coverage and present-day data availability were not re-established by this project. Any future correction should update the opening assessment, affected tables, and linked hub descriptions together.
Related vault context: Crime for measurement and the justice process; Feminism for legal and social interpretation; 60.20 The Boy Crisis for ensuring male victimization is not erased by category boundaries. These connections are retrieval aids, not endorsements of every argument in those notes.
Sources and locators
The numbered citations throughout the synthesis link to the source notes at the end of this document in Reading view. They identify the original reports, dates, populations, tables or page locators, direct links, and material access limits. The preserved earlier material retains its original citations separately.
Preserved earlier research
Earlier working material — retained, with qualifications
The following text predates the 2026 synthesis. Its historical race-specific rates and arrest calculations have not been freshly audited here. In particular, “gold standard” should not imply that NCVS completely measures sexual victimization; a national population denominator does not correct an arrest numerator for nonparticipating agencies; and the older claims about complete national coverage or current availability should not be reused without checking. Preserve the distinctions between survey victimization, recorded offenses, arrests, and offending. The Pinker account is earlier source interpretation, not a new independent causal finding.
Pinker’s Chapter 7 supplement — institutional response and the historical rape decline
Pinker’s central historical shift is conceptual as well as legal: rape moves from an offense against a father, husband, or state to a violation of the victim’s bodily autonomy. He credits second-wave feminism with forcing police, courts, campuses, and social services to take that perspective seriously, while treating the precise causes of the decline as multiple and uncertain—legal reform, specialized services, DNA evidence, incarceration, policing, and the broader crime decline may all contribute.
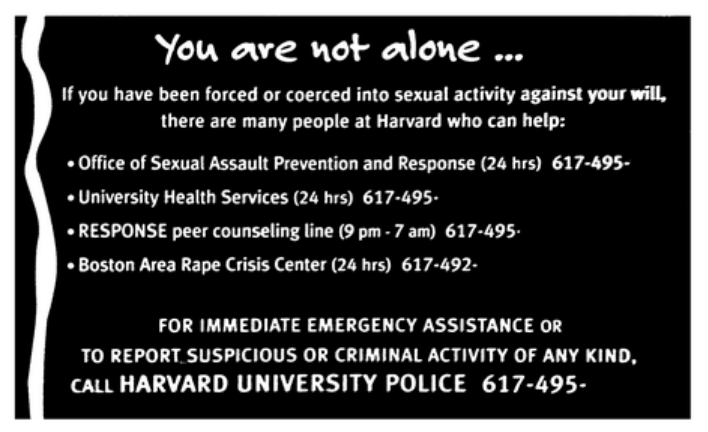
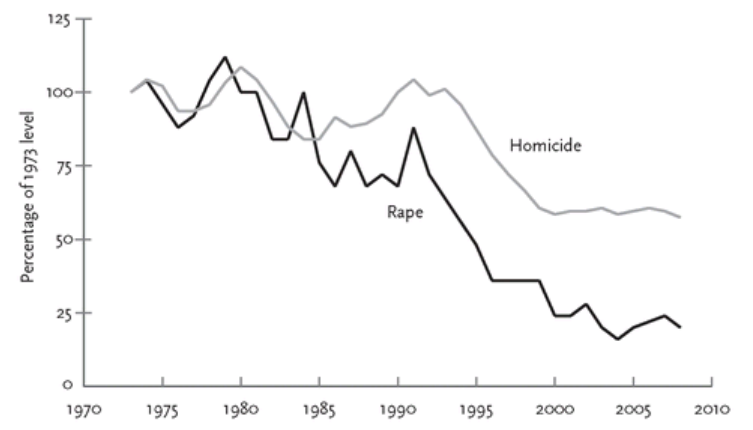
Figures 7-9 and 7-10 — A Harvard response sticker and indexed U.S. rape and homicide trends, 1973–2008. Figure 7-9 is a qualitative artifact of institutional attention, not a prevalence measure. Figure 7-10 uses the National Crime Victimization Survey for attempted and completed rape of people aged twelve or older and the FBI homicide series, setting both to 100 in 1973. On Pinker’s presentation, rape falls from roughly 250 to 50 per 100,000—about 80%—while homicide reaches about 57% of its 1973 level. NCVS interviewing and definitions changed, with earlier estimates adjusted for comparability; greater willingness to disclose over time makes a wholly reporting-driven decline less plausible but does not prove Pinker’s causal account. Use the current BJS material below for present rates. Chapter 7 synthesis · Rape’s legal and moral reframing, PDF pp. 550–560 (file not included in this release) · Figure 7-9, PDF p. 558 (file not included in this release) · NCVS method and limits, PDF pp. 560–562 (file not included in this release) · Figure 7-10, PDF p. 561 (file not included in this release)
1) Victims per capita (NCVS survey)
Best available national race breakdown for rape/sexual assault (multi-year NCVS table):
Average annual rate per 1,000 persons (age 12+) for 2017–2021
- White (non-Hispanic)*: 1.7
- Black (non-Hispanic)*: 1.4
- Hispanic (any race): 1.4
- Asian/NH/Other Pacific Islander*: 1.1 †
- “Other”: 4.2 †
(NCVS race/Hispanic categories are survey categories; dagger † indicates the estimate is less reliable due to small sample sizes/suppression rules.)
Source (Table 1): Bureau of Justice Statistics (BJS), “Violent Victimization by Race or Hispanic Origin, 2008–2021.” https://bjs.ojp.gov/violent-victimization-race-or-hispanic-origin-2008-2021 (Bureau of Justice Statistics)
Context: The NCVS is the gold standard for rates, because it includes both reported and unreported crime. However, single-year race splits for rape/sexual assault are often suppressed (small samples). BJS publishes the overall national rape/sexual-assault rate by year (e.g., 1.9 per 1,000 in 2022; 2023 similar), but not dependable race splits every year.
Sources: “Criminal Victimization, 2022,” BJS report (see Table 1 and notes). https://bjs.ojp.gov/document/cv22.pdf ; overview page: https://bjs.ojp.gov/library/publications/criminal-victimization-2022 (Bureau of Justice Statistics)
2) Offenders per capita (police administrative data → arrest rates)
A practical, reproducible way to approximate offender per-capita rates is to use FBI arrest totals by race for the offense of rape (legacy UCR definition footnoted by FBI) and divide by Census race populations for the same year.
Below I compute 2019 arrest rates per 100,000 residents (the last year with complete national UCR “Table 43A” race detail). These are arrest rates, not offense rates.
Data used
- 2019 arrest counts for “Rape” by race (FBI Table 43A):
White 11,588; Black 4,427; American Indian/Alaska Native 249; Asian 276; Native Hawaiian/Other Pacific Islander 59; Total 16,599.
Source: FBI, “Table 43 – Arrests by Race and Ethnicity, 2019,” row “Rape.” https://ucr.fbi.gov/crime-in-the-u.s/2019/crime-in-the-u.s.-2019/topic-pages/tables/table-43 (click “Download Excel (Table 43A)” or see on-page row) (Federal Bureau of Investigation) - 2019 U.S. population by race (ACS 1-year, ‘race alone’):
White 236,475,401; Black 41,989,671; AIAN 2,847,336; Asian 18,636,984; NHPI 628,683.
Sources: Census data table B02001 (and equivalent 2019 ACS references).
https://data.census.gov/table/ACSDT1Y2019.B02001 ; alternative citations showing the same 2019 figures:
https://data.census.gov/table/ACSSE2019.K200201?tid=ACSSE2019.K200201 ;
Maryland state ACS 2019 U.S. extract (shows the same counts). https://planning.maryland.gov/MSDC/Documents/American_Community_Survey/2019/US_ACS_2019.pdf(Census Data)
Computation (per 100,000 residents, 2019)
- White: 11,588 / 236,475,401 × 100,000 = 4.90
- Black: 4,427 / 41,989,671 × 100,000 = 10.54
- AIAN: 249 / 2,847,336 × 100,000 = 8.75
- Asian: 276 / 18,636,984 × 100,000 = 1.48
- NHPI: 59 / 628,683 × 100,000 = 9.38
(Calculations shown stepwise; I used the exact FBI and ACS figures cited above.) (Federal Bureau of Investigation)
Important caveats on arrest rates
- Arrests ≠ offenses committed. Most sexual assaults are never reported; arrest likelihood varies across jurisdictions.
- Coverage/definitions: 2019 is legacy UCR with a mix of the old and revised rape definitions (FBI footnote 3 in Table 43A). From 2021–present, the FBI relies on NIBRS; national coverage has improved but is still not 100%, and race-by-offense arrest breakouts are not as cleanly published in a single national table. Use 2019 if you need a fully national, single-table snapshot. Source/method notes: FBI Table 43 data declaration. https://ucr.fbi.gov/crime-in-the-u.s/2019/crime-in-the-u.s.-2019/tables/table-43/table-43-data-declaration (Federal Bureau of Investigation)
- Race categories: FBI arrest tables and Census “race alone” denominators are not aligned with Hispanic originthe same way. These rates are race-alone arrest rates, not “non-Hispanic race” rates.
Quick takeaways (how to interpret both lenses together)
- Victimization (NCVS, 2017–2021 avg): rape/sexual-assault victim rates are broadly similar across the largest groups (about 1.4–1.7 per 1,000), with Asian/NHPI a bit lower (1.1†). This is survey-based and includes unreported crime. Source: BJS NCVS table noted above. https://bjs.ojp.gov/violent-victimization-race-or-hispanic-origin-2008-2021 (Bureau of Justice Statistics)
- Arrests (FBI, 2019): arrestee rates for rape per 100k residents differ by race (e.g., Black ~10.5; White ~4.9; Asian ~1.5; AIAN ~8.8; NHPI ~9.4). These reflect policing, reporting, clearance, and charging differences as much as offending. Source: FBI Table 43A + 2019 ACS. https://ucr.fbi.gov/crime-in-the-u.s/2019/crime-in-the-u.s.-2019/topic-pages/tables/table-43 ; https://data.census.gov/table/ACSDT1Y2019.B02001 (Federal Bureau of Investigation)
If you want more
- I can also compute state-level arrest rates (where reported) or compile multi-year NCVS race splits if you’d like a longer trend.
- If you prefer Hispanic/non-Hispanic splits (rather than race-alone), say the word—I’ll re-run with the best-matching denominators and the subset of agencies that report ethnicity.
Footnotes
-
Susannah N. Tapp and Emilie J. Coen, BJS, Criminal Victimization, 2024, September 2025, NCJ 310547. Table 1, printed p. 3; Table 4, p. 7; Table 6, p. 9; rape/sexual-assault classification, pp. 24–25. Primary report. Annual victimizations, U.S. persons aged 12+ within survey scope; legacy instrument. Relevant tables/methods inspected 2026-10-16. ↩ ↩2 ↩3 ↩4
-
Ruth W. Leemis and colleagues, CDC, NISVS: 2023/2024 Sexual Violence Data Brief, December 2025. Definitions, printed p. 2; limitations, p. 4; Table 1, p. 6 / PDF p. 8; Table 6, printed p. 15 / PDF p. 17. Primary report. The PDF’s web-indexed title was incorrect in retrieval; its cover and internal title identify the sexual-violence brief. U.S. noninstitutionalized adults; lifetime and rolling 12-month prevalence. Accessed 2026-10-16. ↩ ↩2 ↩3
-
Sharon G. Smith and colleagues, CDC, NISVS: 2023/2024 Methodology Report, 2025. Introduction, revisions to sexual-violence questions, sampling/data collection, limitations and conclusion (printed p. 15 / PDF p. 18), and Appendix A. Primary report. Explicitly advises against comparisons with previous data years. Accessed 2026-10-16. ↩ ↩2 ↩3 ↩4
-
FBI, Crime in the United States 2013: Rape Addendum, opening definitions and discussion of the revision. Primary addendum. Revised national reporting starts January 2013; legacy and revised categories are not interchangeable. Accessed 2026-10-16. ↩ ↩2
-
Véronique Irwin and colleagues, NCES/BJS, Report on Indicators of School Crime and Safety: 2023, July 2024, postsecondary criminal-incidents section, printed pp. 24–25 / PDF pp. 32–33; 2014 reporting change, footnote 74. Accessible primary report hosted by BJS. NCES indicator. On-campus offenses per 10,000 FTE students, 2011–2021; this historical comparison is not an assertion of latest available campus microdata. ↩ ↩2 ↩3
-
Stanford Institutional Research & Decision Support, 2024 HESMA FAQs, especially survey continuity and demographics; survey documentation gateway. The instrument remains largely the 2019 Westat survey with specified changes. Accessed 2026-10-16. ↩ ↩2 ↩3
-
Westat, Report on the 2024 Higher Education Sexual Misconduct and Awareness Survey, October 21, 2024. Executive summary, printed p. x; response rates, p. 6; conclusions, pp. 63–64; nonresponse analysis, Appendix 4; Table 5, printed A7-5 / PDF p. 216; Table 52, printed A7-155 / PDF p. 366. Primary report. Ten participating universities, since enrollment and current-school-year measures. Accessed 2026-10-16. ↩ ↩2 ↩3 ↩4
-
Bonnie S. Fisher, Francis T. Cullen, and Michael G. Turner, The Sexual Victimization of College Women, NIJ/BJS, December 2000, NCJ 182369. Survey design, screening/incident classification, and NCVS comparison sections. Primary report. OJP publication record. Historical college-women sample; methodological illustration rather than an interchangeable trend point. ↩ ↩2
-
BJS, National Crime Victimization Survey collection documentation, scope and collection overview; accessed 2026-10-16. Includes crimes reported and not reported to police. Use the report methodology for coverage exclusions. ↩
-
BJS, The Nation’s Two Crime Measures, 2015–2024, March 2026, pp. 1–4, especially scope and methodology. Primary report. NCVS victimization and law-enforcement estimates have different populations and offense coverage. ↩
-
34 CFR 668.46, current text accessed 2026-10-16. See (c)(1) for offenses/geography; (c)(2) for recording and unfounded reports; (c)(3) for report year; (c)(9) for classification manuals. Legal/statistical scope only; this note is not a 50-state legal comparison. ↩ ↩2 ↩3
-
Michael Planty, Lynn Langton, Christopher Krebs, Marcus Berzofsky, and Hope Smiley-McDonald, BJS/RTI, Female Victims of Sexual Violence, 1994–2010, March 2013, revised June 11, 2013. Highlights and Figure 1, printed p. 1. Primary report. The specified rate comparison is 1995–2010 despite the report’s broader title. ↩
-
BJS, Criminal Victimization, 2024 publication record, September 29, 2025. Describes the 2024 split sample and confirms this publication uses the legacy instrument. The Table 1 significance notes in the report govern the recent comparison. ↩
-
FBI, FBI Releases 2024 Reported Crimes in the Nation Statistics, August 5, 2025, national violent-crime category changes. Originating-agency estimate of revised-definition rape offenses; accessed 2026-10-16. ↩
-
FBI, Violent Crime Falls at Historic Rate, New FBI Data Show, August 24, 2026, opening category changes and “A broad decline.” Gives 2025 rape offense change and rate. Agency narrative and linked data release; the causal/political interpretation is not adopted. Accessed 2026-10-16. ↩
-
RTI International, Campus Climate Survey Validation Study, April 11, 2016, “Using Methodological Rigor to Gauge the Problem across Schools.” Originating researchers’ account of the nine-school 2014–2015 study; confirms generalization limits and report destinations. Related to, not independent of, the technical report. ↩ ↩2
-
David Cantor and colleagues, Westat/AAU, Report on the AAU Campus Climate Survey on Sexual Assault and Sexual Misconduct, 2019, revised January 2020. Matched 21-school comparison, Table 52, printed A7-119 / PDF p. 426; summary of change, printed p. 80 / PDF p. 110. Revised primary report. Participating university summary. These are the same evidence chain. ↩
-
Westat, New Data Released on Sexual Assault and Misconduct at 10 Universities, October 21, 2024. Originating research organization’s release; headline prevalence and scope. Same underlying study as the report, not independent confirmation. ↩
-
Sofi Sinozich and Lynn Langton, BJS, Rape and Sexual Assault Victimization Among College-Age Females, 1995–2013, December 2014, NCJ 248471. Highlights, p. 1; Table 1 and enrollment definition; Table 8, p. 9. Primary report. Historical average annual victimizations of women aged 18–24; not lifetime prevalence. ↩
-
U.S. Department of Education, Violence Against Women Act, final rule, Federal Register 79, October 20, 2014, pp. 62752–62790; effective July 1, 2015. Primary final rule, overview and revised definitions. This source is used for historical reporting changes, not present Title IX litigation or a claim that all campus behavior was newly criminalized. ↩
-
BJS, Criminal Victimization, 2016: Revised, October 24, 2018, publication annotation on replacement of estimates that did not permit year-to-year comparisons. ↩
-
BJS, NCVS Instrument Redesign, expanded behavior-specific rape/sexual-assault screening and split-sample plans; read with the 2024 annual publication record for what was actually used. Accessed 2026-10-16. ↩
-
CDC, NISVS: 2016/2017 State Report, Table 3.1.b, national women’s lifetime rape prevalence, 26.8%. Primary report. Included only to illustrate why the later redesign cannot be treated as a simple trend. ↩
-
National Research Council, Candace Kruttschnitt, William D. Kalsbeek, and Carol C. House, eds., Estimating the Incidence of Rape and Sexual Assault, National Academies Press, 2014, DOI 10.17226/18605. Summary, especially Conclusions 8-5 through 8-8 and Recommendation 10-1. Independent methodological assessment; applies to the NCVS assessed then, not automatically every later redesign. ↩
-
Christopher Krebs and colleagues, Campus Climate Survey Validation Study Final Technical Report, January 2016, NCJ 249545. Report and OJP methods/publication summary. Selected summary sections inspected; no exhaustive appendix audit. ↩
-
Jennifer S. Hirsch and Shamus Khan, Sexual Citizens, first published 2020; Norton paperback description lists the 2021 paperback; Columbia author/research context, January 3, 2020. Publisher/author context inspected, full text not reviewed. ↩
-
Jon Krakauer, Missoula: Rape and the Justice System in a College Town, 2015 hardcover; Penguin Random House publisher record distinguishes the 2015 original from the 2016 paperback. Publisher description inspected; full text not reviewed here. ↩