The crime and criminal-justice research hub: measurement, repeat offending, policing, culpability, and specific offense categories. The long working analysis below is preserved.
Pinker’s Chapter 3 baseline — homicide across eight centuries
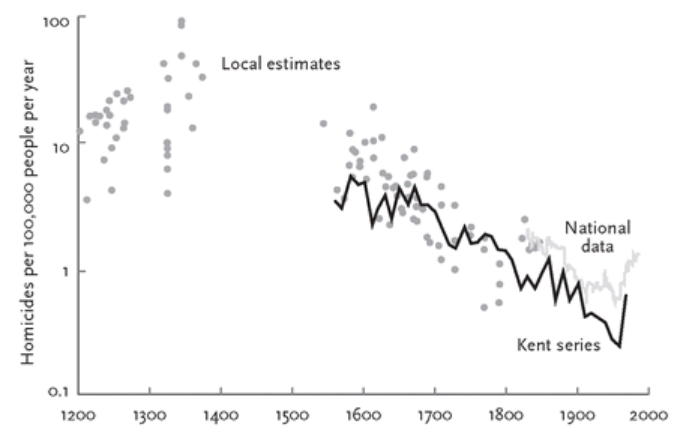
Pinker uses Manuel Eisner’s reconstruction of English homicide to establish a scale that short modern series can hide: estimates fall from roughly 4–100 homicides per 100,000 people in medieval localities to about 0.8 per 100,000 in the 1950s. He treats homicide as the most comparable long-run violence measure because a death is harder to redefine or ignore than robbery, rape, or assault; changing detection and prosecution may even understate the decline, while modern trauma care cannot explain a fall that occurred mainly between 1300 and 1900.
Figure 3-2 — reconstructed English homicide rates, 1200–2000. The magnitude is persuasive evidence of a large decline, but the dots are historical estimates assembled from coroners’ inquests, court files, and local records—not a uniform national series. Jurisdictions, record survival, classifications, and denominators change across centuries. Use it as a long-run baseline, not as a precision comparison with a current FBI or victimization statistic. Chapter 3 synthesis · Figure 3-2 and estimated scale, PDF p. 103 (file not included in this release) · Why Pinker treats homicide as the strongest long-run measure, PDF pp. 104–105 (file not included in this release)
Henrich, Chapter 8 — marriage markets, social bonds, and crime are three distinct claims
Henrich first proposes a structural mechanism: concentrated polygyny can leave more low-status men without realistic marriage prospects, sharpening status competition. Figure 8.1’s result—40% unmarried men under moderate polygyny—is a stylized community, not an observed universal rate. He then cites a more direct life-course design: 500 men from a Massachusetts reform school were followed from age 17 into retirement. Comparing the same men across married and unmarried periods, marriage was associated with roughly half as much property and violent offending and about a 35% reduction across all crimes; good marriages showed a larger effect, and offending rose after divorce or widowhood. This is evidence for stable bonds and changed routines, not for a wedding as an automatic cure. polygyny’s stylized marriage market, Figure 8.1, PDF p. 270 (file not included in this release) · within-person marriage and offending comparison, PDF pp. 283–285 (file not included in this release)
China’s one-child policy supplies a different test: son preference produced male-heavy cohorts, and Henrich reports provincial analyses in which arrests and crime rose as those cohorts reached adulthood. The timing and controls make the association more informative than a single cross-section, but policy timing, migration, enforcement, development, and other provincial changes prevent a clean randomized interpretation. None of this evidence licenses treating unmarried men as criminals, ignoring selection into good marriages, or replacing individual risk assessment with sex-ratio stereotypes. surplus men under China’s one-child policy, PDF pp. 285–286 (file not included in this release) · crime-study qualifications, Chapter 8 endnotes, PDF pp. 568–569 (file not included in this release) · Chapter 8 source audit
Crime Levels and Policing
The Unheralded End of Mass Incarceration — source audit of the article, the arrest → charge → conviction funnel, long-run data limits, and the evidence on whether reform prosecutors can make falling crime an artifact of nonprosecution.
The Hidden Civic Tax of Crime — indirect costs imposed through defensive spending, avoidance, lost trust, and institutional retreat.
Reform prosecutors and measurable case outcomes — modern estimates of about 19–22% fewer charges and 23–25% fewer convictions, separated from upstream crime measures and causal evidence on later offending.
Repeat Offenders Crime Concentration — systematic evidence on chronic-offender concentration; the hindsight/prediction gap; arguments for and against very long terms; and a three-strikes case study with a narrower, reviewable repeat-violent alternative.
Crime - Position Card — debate-ready application of the research, with explicit concessions and burden questions.
Sexual Assault — U.S. college and general-population statistics, historical and recent trends, sexual assault versus rape, definition changes, reporting gaps, and source-qualified further reading (research updated 16 October 2026).
Filicide — population patterns, maternal/paternal comparisons, psychiatric and legal outcomes, insanity-acquittee hospitalization, and deterrence limits.
Lindsay Clancy Case - Culpability and Forfeiture — case-specific evidence and legal posture, Massachusetts NCR commitment law, and an argument map covering deterrence, expressive punishment, rights forfeiture, and culpability.
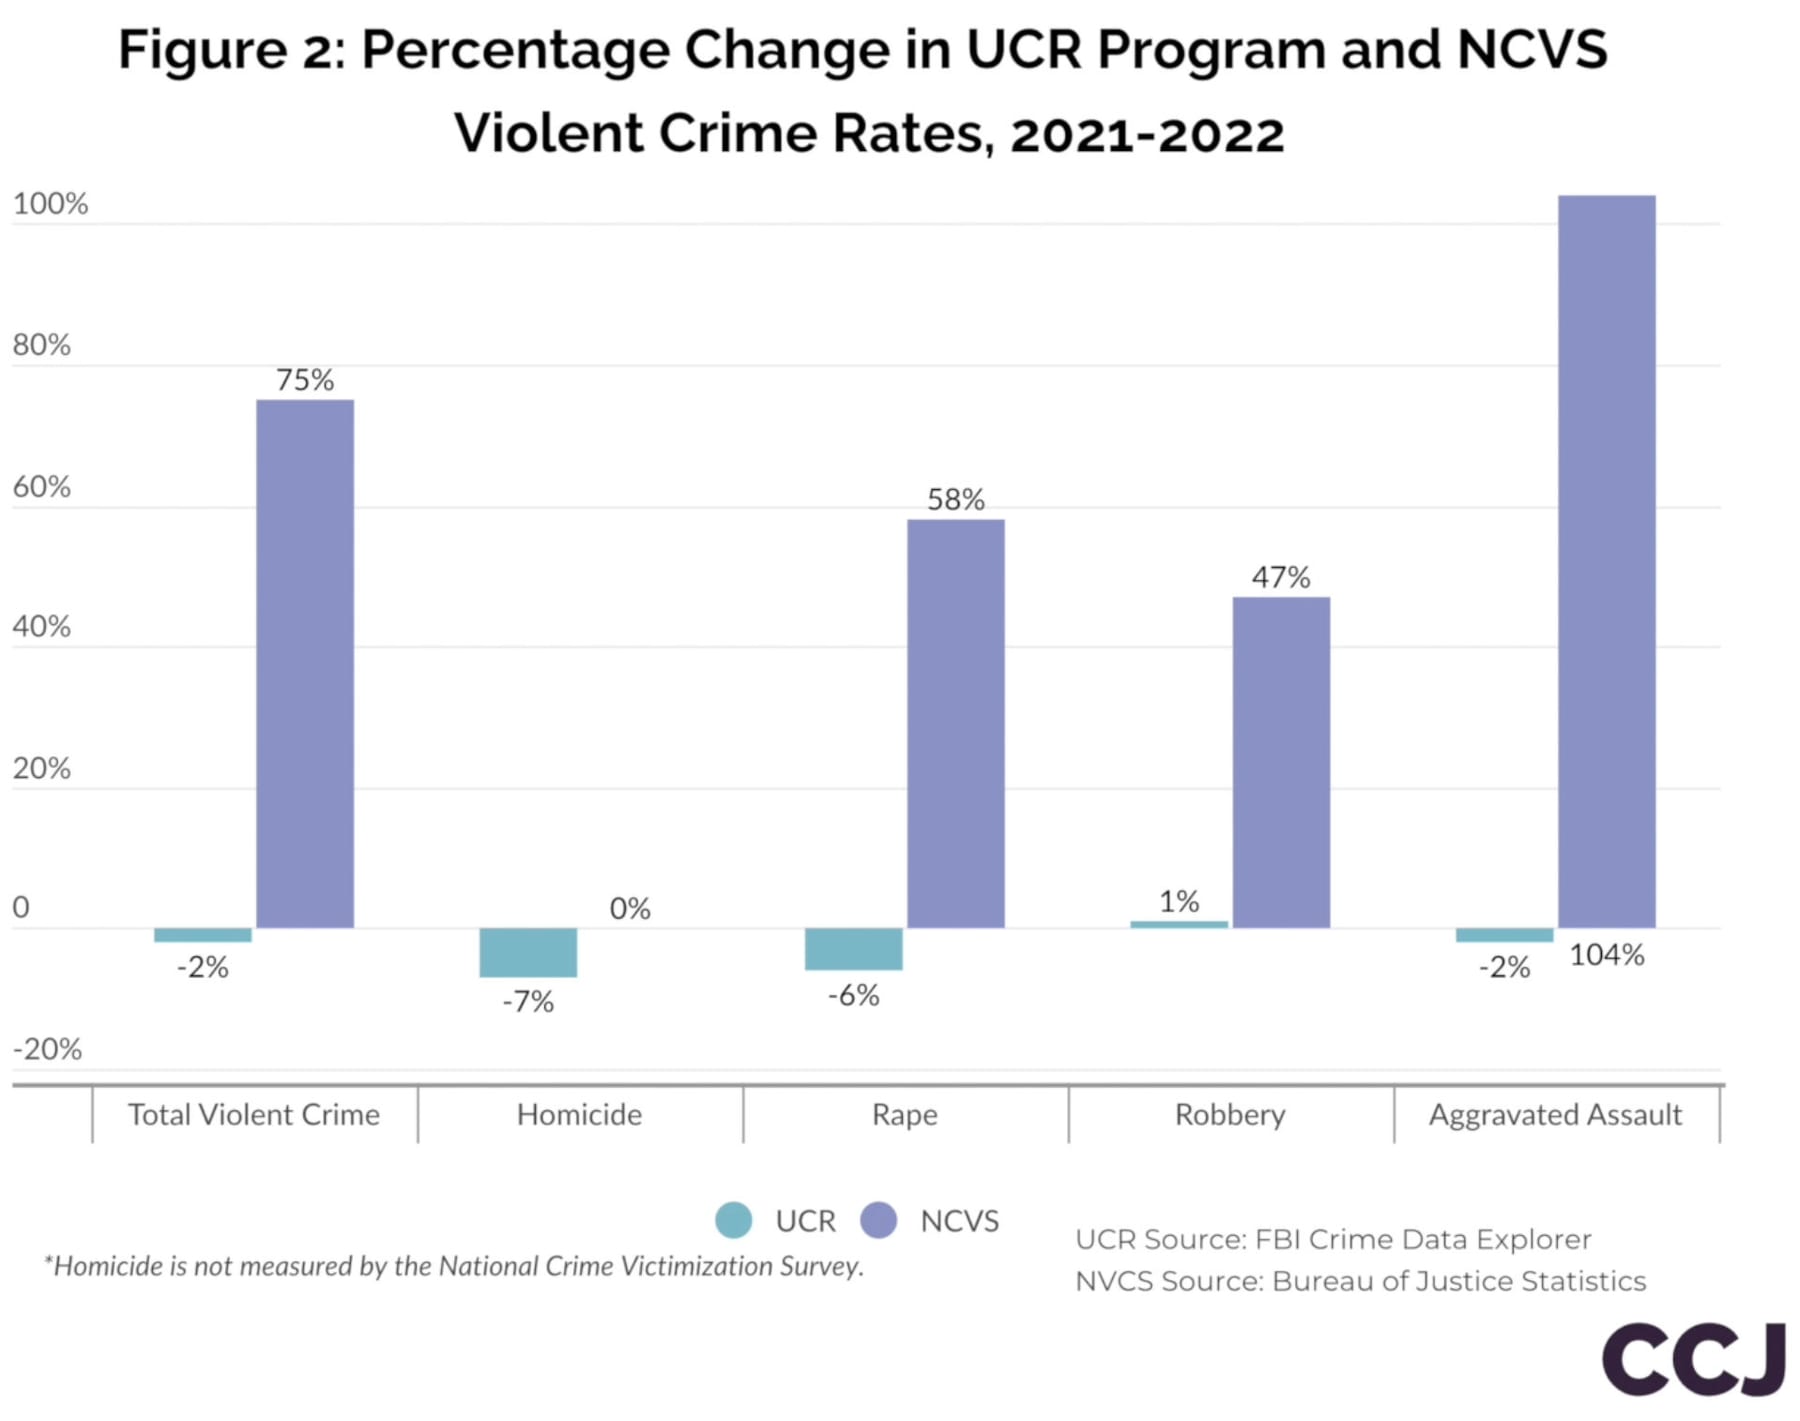
Another problem with FBI crime data is its reliance on reported crimes. Most crimes go unreported, with only about 45% of violent crimes and 30% of property crimes brought to the police’s attention, according to the National Crime Victimization Survey. Since the FBI only tracks reported incidents and this gap is so large, researchers argue that when the media discusses crime rates based on FBI data, they should clarify that it reflects “reported” crime, not give the impression that total crime is changing. Stealth Edit: FBI Quietly Revises Violent Crime Stats | RealClearInvestigations
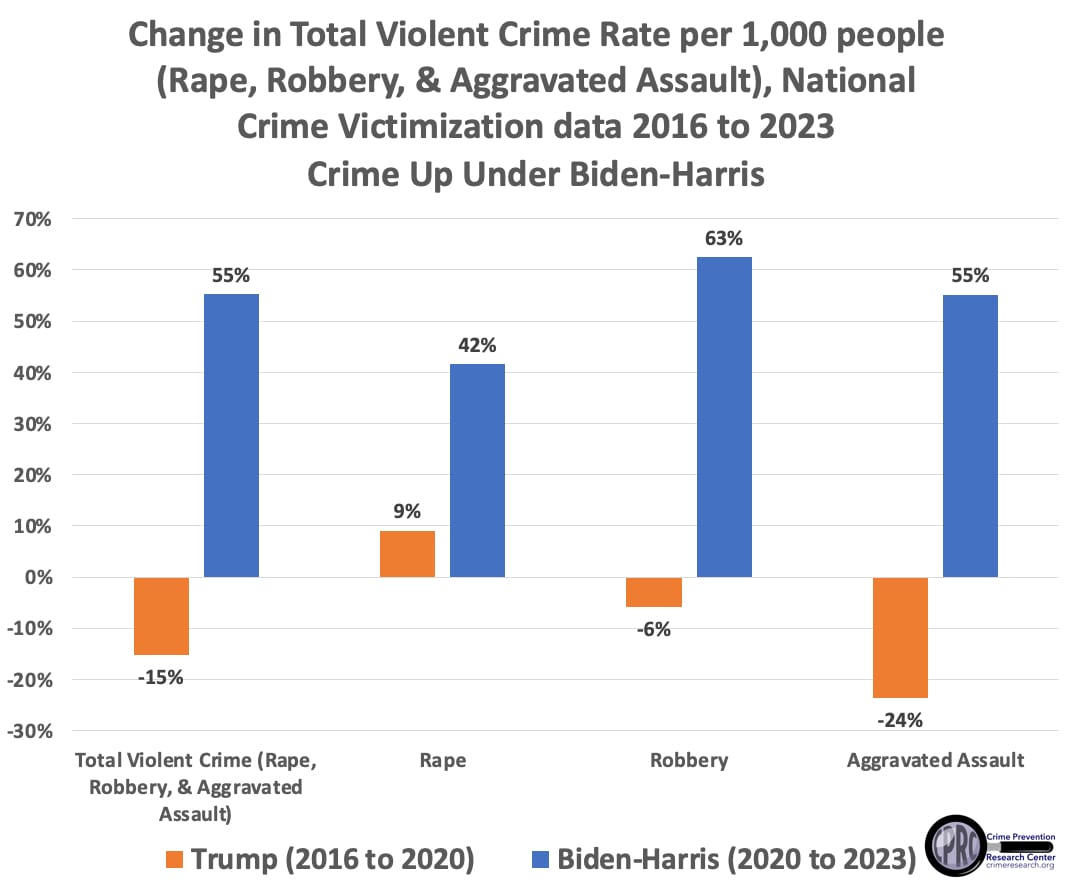
While the FBI claims that serious violent crime has fallen by 5.8% since Biden took office, the NCVS numbers show that total violent crime has risen by 55.4%. Rapes are up by 42%, robbery by 63%, and aggravated assault by 55% during Biden’s term. Since the NCVS started, the largest previous increase over three years was 27% in 2006, so the increase under Biden was slightly more than twice as large. Open: BJS-NCVS-Trump-v-Biden-Harris.jpg
eight in 10 African-Americans and about half of white Biden voters said that they thought that young black men were more likely to be shot to death by police than to die in a car accident—one of the largest mortality risks to the young and healthy.
more than a third of liberal and very liberal respondents thought that the number of unarmed blacks killed by police each year was “about 1,000” or more.
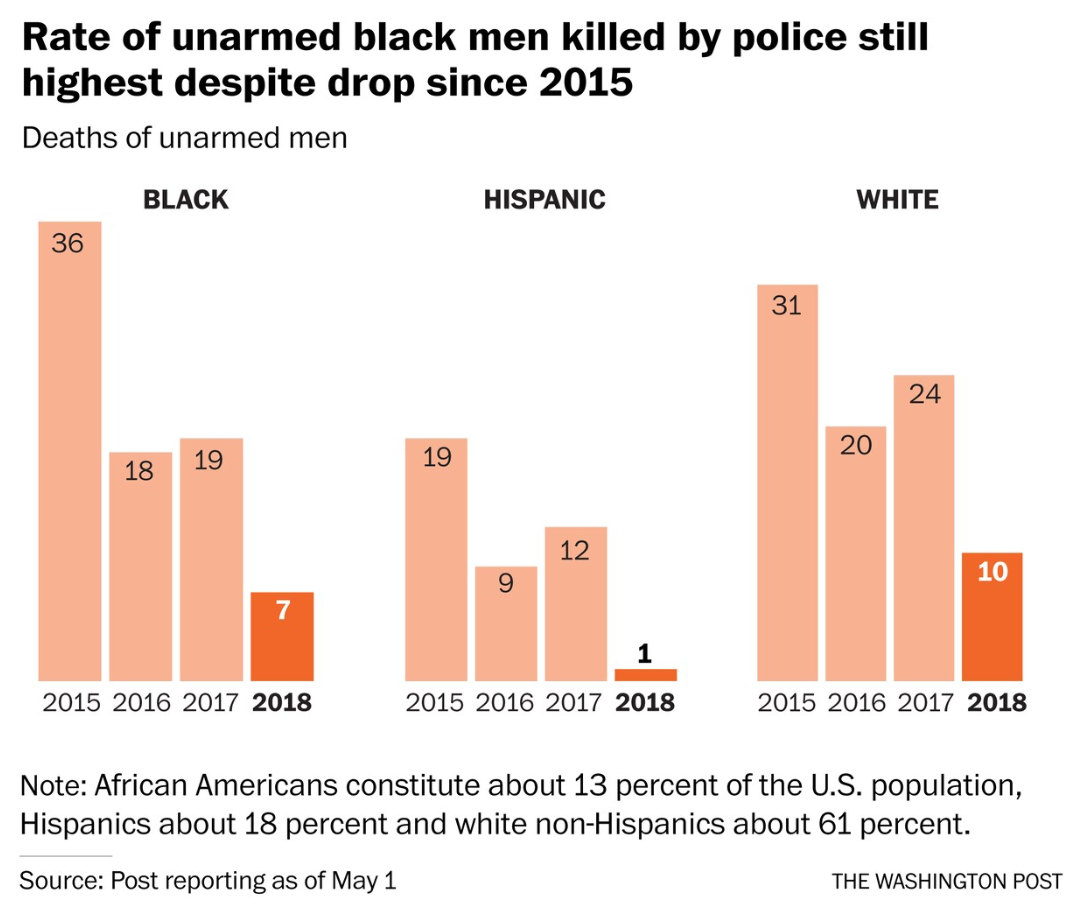
Blacks are an even higher percentage of unarmed civilians shot and killed by police (34%), which is a potential sign of bias. However, not all shootings of unarmed civilians are unjustified, and it is difficult to objectively classify these cases in a more granular fashion. And contrary to the popular perceptions outlined above, confirmed fatal police shootings of unarmed African-Americans number about 22 per year.
Q1. What is the rationalization behind light sentences, catch and release, where people on the streets that have 10+ felonies on their records?
Answer:
The rationalizations behind light sentencing, “catch and release,” and repeat offenders with long rap sheets being on the streets come from a mix of legal, philosophical, and practical considerations:
Legal Philosophy and Sentencing Reform
Rehabilitation vs. punishment: belief that long terms don’t reduce reoffending.
Proportionality: lighter sentencing for low-level crimes, even with priors.
Overcrowded Prisons and Resource Allocation
U.S. has one of the world’s highest incarceration rates.
High cost of incarceration leads to prioritizing violent over nonviolent offenders.
Prosecutorial and Judicial Discretion
Plea bargains reduce charges and sentences.
Some judges lean toward leniency, emphasizing underlying causes (poverty, addiction).
Victims’ rights seen as overlooked. Summary:
The “10+ felonies on the street” outcome reflects a prioritization of rehabilitation and systemic fairness over pure incapacitation, but critics argue it undermines deterrence and community safety.
Q2. What is the recidivism rate of violent offenders?
Answer:
BJS (2019, 30 states, 9 years):
71% of violent offenders rearrested within 9 years.
33% within the first year.
By category:
Homicide: ~39% (lowest).
Assault: ~77%.
Robbery: ~78% (highest).
Rape/sexual assault: ~67%.
Federal offenders (USSC 2016):
~64% rearrested within 8 years, higher than nonviolent (40%). Patterns:
Rearrest risk highest in first 2–3 years.
Homicide offenders least likely to reoffend violently; robbery/assault most likely.
Younger offenders reoffend more. Bottom line: Roughly 2 out of 3 violent offenders reoffend within a decade, though not always with another violent act.
Q3. Has no cash bail, probation, restorative justice, lowering of time contributed to decreasing recidivism of violent offenders?
Answer:
No-Cash Bail
New Jersey: no increase in violent crime/recidivism.
New York: mixed results, with small upticks in some categories, confounded by COVID.
Overall: neutral to modest.
Probation & Supervision
Traditional probation weak.
Intensive, treatment-backed supervision can reduce recidivism modestly.
Restorative Justice
Meta-analyses show small-to-moderate reductions in recidivism.
Strongest evidence for youth/property offenses; mixed for violent adults.
Shorter Sentences
Longer terms don’t reduce recidivism; may worsen it.
Releasing earlier does not increase violent recidivism. Overall picture:
No single reform dramatically reduced violent recidivism.
Restorative justice + intensive supervision work best.
Bail reform and shorter sentences are mostly neutral.
Probation helps only when structured effectively.
Q4. If you give a violent offender less time, how much does that affect the person not doing another violent act again?
Answer:
Meta-analyses: Longer sentences don’t reduce violent recidivism; some evidence shows they slightly increase it.
Why? Prison hardens offenders, severs ties to work/family, and builds criminal networks.
BJS data: Sentence length is not a strong predictor; age and prior history matter more.
National Research Council (2014): No credible evidence that longer sentences reduce post-release violent crime.
European comparisons: Countries with shorter sentences + strong reintegration programs have lower violent recidivism than the U.S.
Age factor: Offenders released older are less likely to reoffend; releasing at peak age (20s) raises risk. Magnitude:
Studies generally show no significant difference in violent recidivism between longer and shorter terms.
Example: California’s 2011 “realignment” showed early releases did not increase violent reoffending. What matters more:
Programs (cognitive-behavioral therapy, substance abuse treatment, reentry supports) reduce violent recidivism by 10–20%. Bottom line: Sentence length alone has little effect; what happens during and after custody matters far more.
Q5. What are the findings and discussions concerning if the violent individual is given multiple convictions of a violent crime, got short sentences to attempt to stop recidivism, yet they continue to do violent crime. Does the law or reform take into account repeat offenders that are going to continue doing violent crime and they have to be in prison?
Answer:
Yes, U.S. law and reforms do account for chronic violent offenders. Key mechanisms:
Pretrial detention for dangerousness
Federal Bail Reform Act (upheld in U.S. v. Salerno): allows detention if no conditions ensure safety.
Most states have similar provisions (NY was a partial exception but amended laws in 2020–23).
Repeat violent offender sentencing enhancements
New York Persistent Violent Felony Offender law: enhanced terms after two violent felonies.
Federal Career Offender Guideline & ACCA: long mandatory minimums for repeat violent/drug offenders.
Civil commitment for certain sexually violent predators after sentences end.
Reforms and carve-outs
Bail reform states (e.g., NJ, NY) added exceptions for repeat/violent offenders.
Sentencing reforms generally still reserve long terms for proven repeat violent actors. Why repeat harm still occurs:
Prediction is imperfect (risk tools can miss cases).
Local discretion varies (prosecutors/judges differ).
Resources for supervision/treatment uneven. Bottom line:
The law does provide for incapacitation of repeat violent offenders.
The system fails mainly in application, not lack of legal tools: discretion, predictive limits, and local policy lead to violent offenders sometimes avoiding longer incapacitation.
Black on White/White on Black Crime Statistics
Homicide (Murder) — 2019 Data
The most recent clear breakdown by both offender and victim race comes from the FBI’s 2019 Expanded Homicide Data:
White victims killed by Black offenders: 566
Black victims killed by White offenders: 246 (Federal Bureau of Investigation, Wikipedia)
This shows that, in single-victim/single-offender homicides where race was known in 2019, there were 566 incidents of Black-on-White homicide versus 246 of White-on-Black.
Why More Recent Data Isn’t Available in That Detail
The 2024 FBI “Crime in the Nation” report released in August 2025 includes totals of reported offenses (over 14 million) and general crime trends (e.g. violent crime down 4.5%) but does not include a race-of-offender by race-of-victim breakdown (Federal Bureau of Investigation, AP News).
The 2024 Hate Crime Statistics include total numbers of hate crime incidents, offenses, victims, and known offenders, but these are categorized by bias motivation (e.g. anti-Black, anti-White) and not by the race of offender versus the race of victim (Department of Justice, USAFacts).
The FBI’s Crime Data Explorer (CDE) may contain raw data where race-of-offender and race-of-victim combinations might be available, but the publicly released summaries and reports don’t break it down in the way you’re asking — particularly for violent crimes outside of homicide and hate crime classifications.
Summary
Most recent reliable number for homicide where offender and victim race are both known (2019):
No newer publicly available data includes a comprehensive count of “Black-on-White violent crimes” across all violent categories with that level of racial detail.
I wasn’t able to locate a comprehensive count of all violent crimes (beyond homicide) where both the offender and the victim are identified by race (e.g., Black-on-White violent incidents) in the FBI’s publicly released 2019 Crime in the United States report or through the Summary Reporting System (SRS).
What the FBI Does Provide for 2019
The 2019 report includes detailed race-of-arrestee data, showing, for example, that White individuals accounted for 59.1% of violent crime arrests, while Black individuals represented 26.6% of arrestees (Federal Bureau of Investigation).
However, that only reflects the race of the offender (arrestee), not the race of the victim.
The Expanded Homicide Data clearly shows cross-racial homicide counts: 566 Black-on-White and 246 White-on-Black homicides in single-victim/single-offender cases (Federal Bureau of Investigation).
Beyond homicide, the SRS/NIBRS detailed breakdown of offender race by victim race across all violent offenses isn’t included in the standard annual summary; it would require accessing NIBRS raw data files rather than summary tables (Federal Bureau of Investigation, Federal Bureau of Investigation).
What About Non-Fatal Violent Crime?
For a broader view, we can turn to the Bureau of Justice Statistics (BJS), which relies on victim reports. According to a summary table aggregating 2017–2021 data:
There were approximately 371,540 violent incidents involving White victims and Black offenders.
During the same period, there were about 243,880 incidents involving Black victims and White offenders(Bureau of Justice Statistics).
This suggests that over that five-year span, White victims experienced more reported violent incidents by Black offenders than Black victims did by White offenders—though this is not specific to 2019 alone.
Summary Snapshot
Violent Crime Type
Statistic
All Violent Crimes (FBI 2019)
No published cross-race totals available in the public summary reports. Requires NIBRS access.
~371,540 White-victim/Black-offender incidents; ~243,880 Black-victim/White-offender incidents.(Bureau of Justice Statistics)
In short: No, the FBI’s published 2019 report doesn’t provide a cumulative number of all violent crimes (beyond homicide) broken down by both offender and victim race. The homicide data is detailed, but non-fatal incidents require separate sources like NIBRS or BJS.
Good — let’s work this out carefully per capita, using U.S. Census population estimates from the 2017–2021 period(to align with the Bureau of Justice Statistics data you cited).
Step 1. Population Baselines (2017–2021 average)
White alone (non-Hispanic): ≈ 197 million
Black or African American alone: ≈ 41 million
(Source: U.S. Census ACS estimates for that time frame)
Step 2. Raw Incident Totals (from BJS)
White victims, Black offenders: 371,540 incidents
Black victims, White offenders: 243,880 incidents
Step 3. Per Capita Rates
We divide incidents by the size of the relevant victim population, then scale to per 100,000 people for comparability.
A. White victims of Black offenders
371,540197,000,000×100,000
= 188 incidents per 100,000 White individuals
B. Black victims of White offenders
243,88041,000,000×100,000
= 595 incidents per 100,000 Black individuals
Step 4. Comparison
Victim–Offender Pairing
Total Incidents (2017–21)
Victim Population
Per 100k Victims
White victim, Black offender
371,540
~197M Whites
188 per 100k
Black victim, White offender
243,880
~41M Blacks
595 per 100k
Key Takeaways
Absolute numbers: More White victims of Black offenders (371k vs. 244k).
Per capita rates: Black individuals were over three times more likely (595 vs. 188 per 100k) to experience violent victimization by White offenders than White individuals were by Black offenders.
This shows how absolute numbers and per capita rates can tell different stories—because the White population is much larger, the raw count of White victims is higher, but the rate of victimization for Black victims is substantially higher.