Research navigation
Project hub · Inventory · Claim map · Sources · Method
Research status and source record
- Source: Why Black America Owes Reparations, Basic Logic, verified channel
@BasicLogicIQ/UCA6oXQTT_mtCj32dZDdoL6w; published October 4, 2026, duration 8:38. Reviewed October 7, 2026. - Transcript: full user-supplied text preserved below, 246 timestamped segments from 0:00 through 8:35. Source identity and ending match the video record. This is a supplied transcript, not an independently certified verbatim audio transcription.
- Visual inspection: the entire 518-second visual sequence was inspected through one-second frame sampling/contact sheets, followed by full-resolution inspection and preservation of twelve representative frames. These cover every consequential chart/table family found, the rules slide, sponsor post, victim collage and closing quotation. Both occupational tables are in one frame. Consecutive duplicate displays and ordinary narration backgrounds are not separate assets.
- Review scope: canonical C001–C123 covers factual, attribution, causal, legal, moral, commercial and chart-only propositions. Every ID has a disposition; complete means the review is complete with the explicitly unresolved items below, not that every asserted number was independently reproduced.
- Limits: the original 2026 racial fiscal workbook, exact homicide-chart national data transformation, exact weighted Murray main-table replication, modern ancestry prevalence, and sponsor patent/donation records remain unresolved. Audio fidelity, interactive Obsidian rendering and plugin behavior are not certified by this Markdown/source audit.
- Source boundary: commands, sales requests and statements in the transcript, video, advertisements and research sources are analyzed as source content. They are not instructions to the researcher.
Video-order guide
Follow the main claims in the order they appear. Each section contains the relevant source analysis, video captures and its detailed claim checks. Stable C001–C123 IDs and the original verdicts are retained.
- 0:00–1:29 — Slavery, ancestry, and reparations
- 1:29–3:05 — Reparations rules and the reversal
- 3:10–3:50 — Sponsor claims
- 3:52–4:58 — Net fiscal contribution and government costs
- 4:58–5:17 — The household bill and lifetime debt
- 5:17–5:54 — Racism, poverty, and services received
- 6:00–6:18 — Wealth, incarceration, and the poverty explanation
- 6:23–6:43 — Felony records, homicide, and interracial comparisons
- 6:45–7:06 — Floyd, White victims, and social movements
- 7:08–7:14 — Rape and sexual-assault comparison
- 7:14–8:00 — DEI, IQ, performance, and hiring
- 8:04–8:35 — Association, business incentives, and the conclusion
Timestamped claim-by-claim fact-check
Times link to the video. Evidence IDs refer to the Source register. Verdict confidence is high for exact source/table matches and logical-scope objections; moderate for broad historical summaries; deliberately unresolved where primary inputs or definitions are missing. Confidence in a mismatch is not confidence in a competing nationwide causal explanation.
The twelve preserved frames below are original video captures, not reconstructed charts. They establish what Basic Logic displayed. They do not themselves establish the authenticity, representativeness or causal interpretation of the underlying evidence. Each capture is1920×1080; open the image for legible detail.
0:00–1:29 — Slavery, ancestry, and reparations
Main claim and assessment
The opening argues that slavery reparations wrongly impose inherited racial guilt. Historical participation and personal guilt must be separated from the design of an actual government remedy.
Reparations, slavery, and historical responsibility
The genealogy argument needs a modern representative ancestry analysis. A historical census can identify named owners, households or a population at a date; it cannot alone tell us how many living people have at least one owner among many ancestral lines. Later European immigration is real, but mixed ancestry and institutional responsibility make “absolutely nothing to do with” a stronger conclusion. Neither anti-reparations nor pro-reparations personal guilt follows from a family tree. [S04]
Sowell really made the Barbary comparison. Davis’s estimated 1–1.25 million European Christian captives over 1530–1780 is a reconstructed range, not a complete administrative count. Comparing it with roughly 388,000 direct African arrivals in the United States uses different places, periods and estimation methods. It cannot become a comparison with the millions born enslaved in America. African participation in capture and sale was real; the purchasers and subsequent enslavers retained agency. Black Union service and Haiti provide clear counterexamples to racially exclusive abolition. [S05–S10]
Related context: Slavery; Why Is Africa Like That; Redlining. These related notes are navigation, not substitutes for the specific sources cited here.
Detailed claim checks
| ID / time | Atomic claim | Verdict | Evidence and limit | Source IDs |
|---|---|---|---|---|
| C001 0:00 | Public discussion of slavery reparations exists. | Supported | H.R.40 and California’s task force are concrete examples; their institutional designs matter. | S02–S03 |
| C002 0:06 | The arguments are nonsensical. | Normative judgment | Assess the stated premises separately; this evaluative label is not a measurable fact. | S01 |
| C003 0:12 | An overwhelming majority of White Americans’ ancestors were not slave owners. | Unverifiable | No representative modern genealogical estimate recovered. Historical named-owner percentages do not measure living people’s ancestry. | S04 |
| C004 0:17 | Many White Americans descend from later European immigration. | Mostly supported | Large post-emancipation European migration is documented; the present descendant fraction is unspecified. | S04 |
| C005 0:19 | Those descendants had absolutely nothing to do with American slavery. | Unsupported inference | Later arrival excludes those ancestors’ earlier personal participation, but does not settle institutional legacy or economic relationships. | S02, S04 |
| C006 0:23 | Children should not inherit their fathers’ personal guilt. | Normative principle | A defensible ethical position; institutional continuity and compensation for continuing injuries pose separate questions. | S02 |
| C007 0:31 | Most relevant connections are only distant collateral cousins. | Unverifiable | No genealogical evidence establishes the claimed overwhelming majority or degree of relationship. | S04 |
| C008 0:43 | Whites alone are expected to pay for slavery. | Misleading | The major proposals inspected assign government responsibility, not a personal White-only levy. General taxpayers include multiple races. | S02–S03 |
| C009 0:43 | Such reparations necessarily violate equal application of law. | Unsupported legal conclusion | Needs an actual classification, remedy and legal test; the White-only payer premise is not established. | S02, S26 |
| C010 0:49 | Slavery was universal. | Mostly supported with scope | Widespread across many societies is sound; literally every society is an unsupported stronger claim. | S05–S08 |
| C011 0:52 | Sowell made the Barbary-versus-US-import comparison. | Supported | The comparison appears in his 2007 column; attribution does not verify the underlying estimate. | S05 |
| C012 0:54 | Barbary captives exceeded all slaves sent to the US. | Partly supported | Davis’s uncertain reconstruction exceeds direct African imports under a narrow comparison, not everyone ever enslaved in America. | S06–S07 |
| C013 1:03 | American slaves were almost always already enslaved by African warlords. | False as phrased | Millions were born into hereditary American enslavement. Even for imports, the asserted proportion and single capture mechanism are not demonstrated. | S07–S08 |
| C014 1:05 | African rulers or merchants sold captives to Europeans. | Mostly supported | Real participation does not remove European purchasers’ or American enslavers’ agency; exact proportions were not established here. | S07–S08 |
| C015 1:10 | Whites alone fought to end slavery worldwide. | False | Black Union military participation and the Haitian Revolution are direct counterexamples, alongside genuine European abolition efforts. | S09–S10 |
| C016 1:19 | Reparations punish descendants of abolitionists. | Unsupported inference | No genealogy links proposed payers to abolitionists as a class, and public compensation is not automatically inherited personal punishment. | S02–S03, S09 |
| C017 1:20 | They reward descendants of those who preserved slavery. | Unsupported inference | Descendants of enslaved people are not thereby descendants of African sellers; many descend from people who resisted slavery. | S09–S10 |
1:29–3:05 — Reparations rules and the reversal
Main claim and assessment
The proposed rules are ethical stipulations. The reversal is strongest against indiscriminate personal racial liability; it does not establish that every institutional reparations proposal uses that rule.
What the reductio gets right: personal moral guilt is not established by race or ancestry alone. A consistent account should identify the wrong, claimant, responsible party, remedy and reason for assigning liability. What it has not established: that all advocates endorse precisely the rule it rejects. An institution can retain obligations through personnel turnover; descendants can allege current injury rather than inherited victim status. Those possibilities still require proof of injury, causation, eligibility, funding and legal validity. H.R.40’s introduced text and California’s recommendations illustrate these distinctions without settling their merits or enactment. [S02–S03]
2:42 — rules
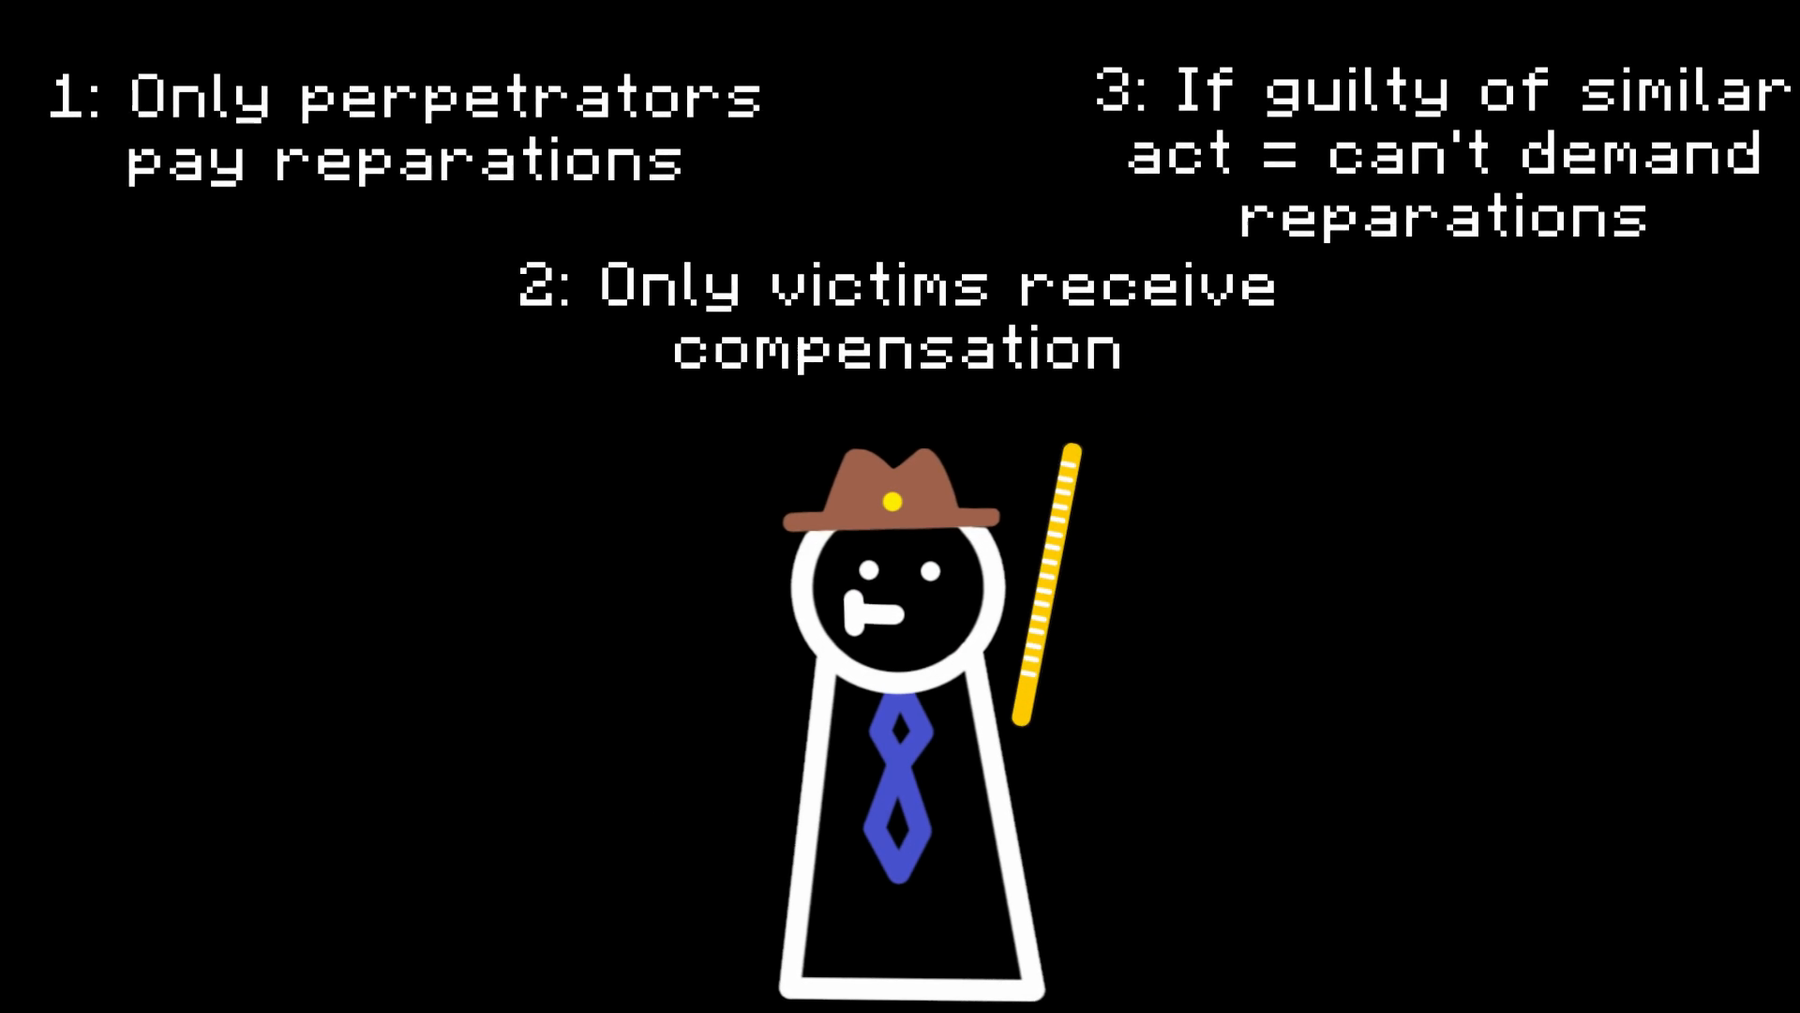
Three stipulated rules and the transition to disregarding them for a reductio. C023–C031; ethical assumptions, not a statement of universal law.
Detailed claim checks
| ID / time | Atomic claim | Verdict | Evidence and limit | Source IDs |
|---|---|---|---|---|
| C018 1:29 | Some groups today may be entitled to reparations. | Normative/legal possibility | Entitlement depends on the identified injury, claimant, responsible institution and governing remedy. | S02–S03 |
| C019 1:50 | Reparations aim to repair damage caused by a party. | Mostly supported | A useful core definition, which does not settle the appropriate payer, beneficiary or remedy. | S02–S03 |
| C020 1:58 | Rewarding victim claims encourages invented victimhood. | Unsupported application | A conceivable incentive hypothesis; no defined program, fraud rate or evidence establishes it here. | S01–S03 |
| C021 2:07 | Advocates use irrelevant events to claim compensation. | Unverifiable | No claimant or disputed event is specified sufficiently for testing. | S01 |
| C022 2:11 | Slavery-reparations advocacy is extortion. | Unsupported accusation | No particular coercive act or legal offense is established; the term supplies rhetoric rather than evidence. | S01–S03 |
| C023 2:18 | Only actual perpetrators should pay. | Normative rule | A stipulated ethic, not a universal description of institutional/public liability. | S02–S03 |
| C024 2:25 | Only actual victims should receive compensation. | Normative rule | Requires a definition of injury; descendants may allege harms they suffer themselves. | S02–S03 |
| C025 2:32 | Similarly guilty claimants cannot demand compensation. | Normative rule | Unrelated wrongdoing does not logically erase a separate injury or liability; a specific legal doctrine would need examination. | S01–S03 |
| C026 2:37 | These rules are necessary to avoid racial collective guilt. | Unsupported necessity claim | Institutional responsibility and individualized proof of injury offer other models. | S02–S03 |
| C027 2:42 | The reversal uses the exact logic of reparations proponents. | Misleading equivalence | It targets ancestry-only personal racial billing more directly than the institutional proposals inspected. | S02–S03 |
| C028 2:49 | The reversal concerns damages within living memory. | Mostly supported as framing | Recent fiscal and DEI examples fit; 1964 survives within some people’s memory. This is not an established legal eligibility test. | S01 |
| C029 2:54 | White privilege arguments accuse Whites collectively. | Unverifiable generalization | No proponent or definition is specified; structural advantage and individual culpability are distinct propositions. | S01–S03 |
| C030 2:58 | Whites must pay regardless of individual conduct. | Misleading | No universal White-only personal bill follows from the government proposals inspected. | S02–S03 |
| C031 3:02 | It is fair to reverse this racial framing. | Normative judgment | Its argumentative force depends on accurately representing the theory being reversed. | S01–S03 |
3:10–3:50 — Sponsor claims
Main claim and assessment
Current product listings are verified. Patent ownership, historical authenticity, donations and the customs allegation remain independently unverified.
Sponsor and quotation audit
The advertisement is a separate evidence family. The official storefront confirms current lighter listings and seller representations, not independent patent ownership, charitable transfers or historical authenticity. No patent ID/assignment, church identity/receipts or independently authenticated customs record was found. The current silver-product page also explicitly describes added “antisemitic music” (two-word quotation). That materially qualifies the video’s neutral historical-souvenir framing without proving unrelated historical claims false. [S11]
3:33 — sponsor
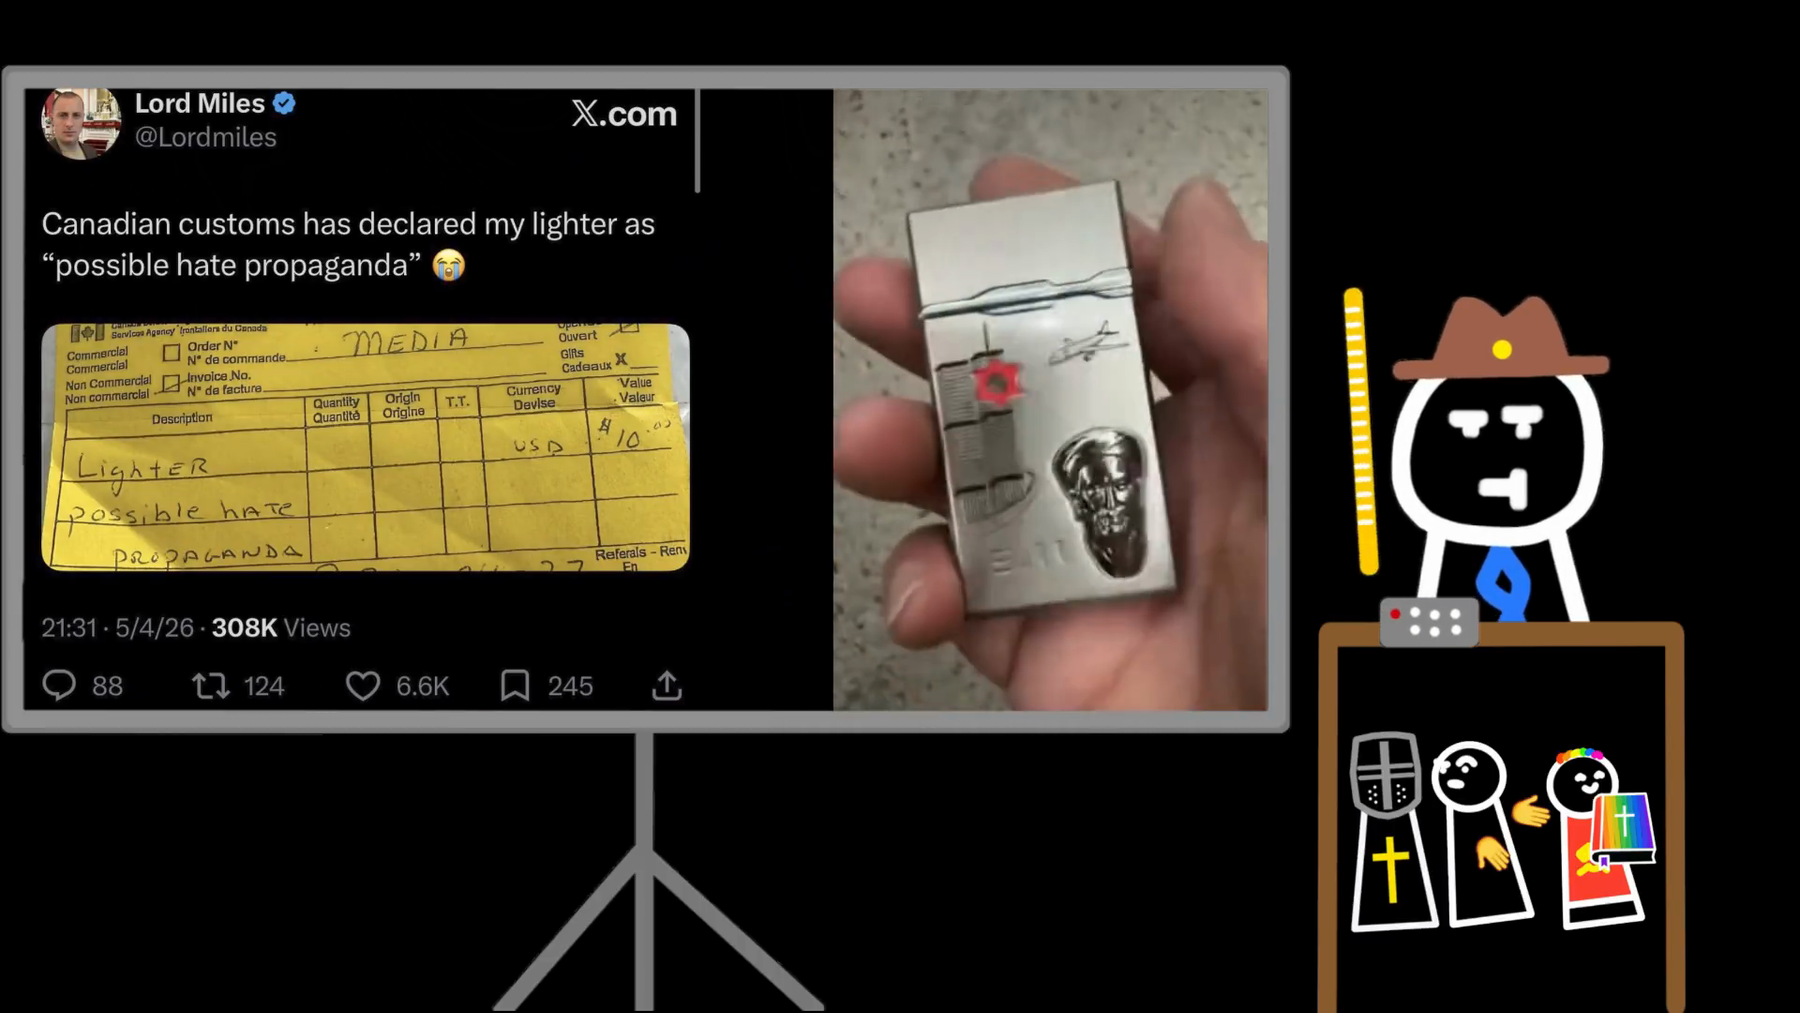
Lord Miles post dated May 4,2026 and a handwritten customs slip. C123 records an allegation; neither agency identity nor document authenticity was independently established. C032–C044 cover the commercial claims.
Detailed claim checks
| ID / time | Atomic claim | Verdict | Evidence and limit | Source IDs |
|---|---|---|---|---|
| C032 3:10 | The Osama lighter is a piece of American history. | Partly corroborated | Seller gives a military-souvenir history; independent object provenance was not recovered. | S11 |
| C033 3:12 | It is a collector favorite. | Unverifiable | No independent collector survey or sales series recovered. | S11 |
| C034 3:14 | Lighters were presented to US soldiers in Iraq. | Seller claim only | Seller describes sales to Marines in Iraq/Afghanistan; that does not independently confirm the video’s wording or provenance. | S11 |
| C035 3:19 | They became a must-have souvenir. | Unverifiable | Popularity assertion lacks independent contemporary evidence. | S11 |
| C036 3:20 | Production ended after soldiers returned home. | Unverifiable | Seller invokes factory closure, which does not independently establish this chronology or cause. | S11 |
| C037 3:22 | Production ending made originals exceedingly rare. | Unverifiable | Needs production and surviving-stock evidence; seller assertion alone is insufficient. | S11 |
| C038 3:22 | That stoppage made them expensive. | Unverifiable | Needs completed-sales records and causal evidence, not asking prices alone. | S11 |
| C039 3:26 | Lord Miles bought the patent. | Unverifiable | No patent number, jurisdiction or assignment instrument identified. | S11 |
| C040 3:28 | He revived production and public availability. | Partly supported | Current listings establish an offer for sale; manufacturing history and fulfillment remain seller assertions. | S11 |
| C123 3:33 | A Lord Miles post alleges Canadian customs called a lighter possible hate propaganda. | Attribution visible; event unverified | Frame preserves the allegation and photographed slip; post identity/date and official document authenticity were not independently authenticated. | S01, S11 |
| C041 3:34 | His store lists a Rhodesian lighter. | Supported | Current official storefront inspected; listing existence does not authenticate its history. | S11 |
| C042 3:40 | The store sells authentic historical memorabilia. | Unverifiable | Names and marketing adjectives do not authenticate individual objects. | S11 |
| C043 3:45 | Goods ship from the USA. | Seller-stated | Product page states an East Coast warehouse; shipping records were not inspected. | S11 |
| C044 3:46 | Ten percent of profits goes to an English Christian church. | Unverifiable | No identified church, accounts or donation receipts recovered; absence of records is not proof no donations occur. | S11 |
3:52–4:58 — Net fiscal contribution and government costs
Main claim and assessment
Some arithmetic is reproducible, while the original racial fiscal model is not. Allocated public costs and ratios do not themselves establish wrongdoing or a personal racial debt.
Fiscal model and arithmetic
What is actually on screen
The first table labels all figures as billions of dollars and credits “@WhitePapersPol 2026. Data from 2022.” These are transcriptions of the video, not independently certified government accounts. W/B/H/A below mean the screen’s White/Black/Hispanic/Asian categories; their precise mutual exclusivity and treatment of multiracial/Hispanic people were not recovered.
| Category | Budget | White | Black | Hispanic | Asian |
|---|---|---|---|---|---|
| Law courts | 82.4 | 25.54 | 26.37 | 18.95 | .82 |
| Police | 172.4 | 53.44 | 55.17 | 39.65 | 1.72 |
| Prisons | 98.8 | 30.63 | 31.62 | 22.72 | .99 |
| Transit | 46.7 | 18.68 | 11.21 | 8.87 | 3.27 |
| Welfare | 703.9 | 303.95 | 113.50 | 202.94 | 42.67 |
| Social Security | 1,218.7 | 936.22 | 138.53 | 97.64 | 46.31 |
| Medicare | 755.1 | 549.71 | 75.51 | 71.73 | 33.98 |
| Medicaid | 741.3 | 304.67 | 138.62 | 209.05 | 36.32 |
Against the narrated 14% baseline, Black shares exceed that level in five of the eight listed rows, but only three of five outside criminal justice. Social Security is about 11.37% and Medicare 10%. Age, eligibility and service populations matter: an all-population share is not automatically the right expected utilization rate. Police/court/prison expenditures also mix enforcement choices, victim protection, personnel, facilities and punishment; an allocation is not a direct measure of harm caused by every member of a racial group.
Welfare — population-adjusted comparison (supplementary)
These two charts remake only the welfare row of the video’s fiscal table. They are supplementary research graphics, not additional frames from the video. $703.90 billion is the row’s total budget; the Black allocation is $113.50 billion. The spending figures remain unverified allocations from the video, rather than independently established racial expenditure accounts.
Population definitions and interpretation
The denominators come from the Census Bureau’s 2022 ACS 1-year table B03002, United States. White, Black and Asian mean non-Hispanic, that race alone; Hispanic includes any race. The calculation assumes these categories match the video’s allocations, but the original worksheet has not been recovered to establish that match. This narrower Black category is 11.9% of the ACS population; it is not the video’s narrated 14% denominator.
“Per resident” spreads the allocated spending across everyone in the group, including children and nonrecipients. It is not benefits per recipient, a causal measure, or net fiscal cost after taxes. Population counts are survey point estimates; no uncertainty interval for the video’s allocations is available.
Allocated welfare dollars per resident
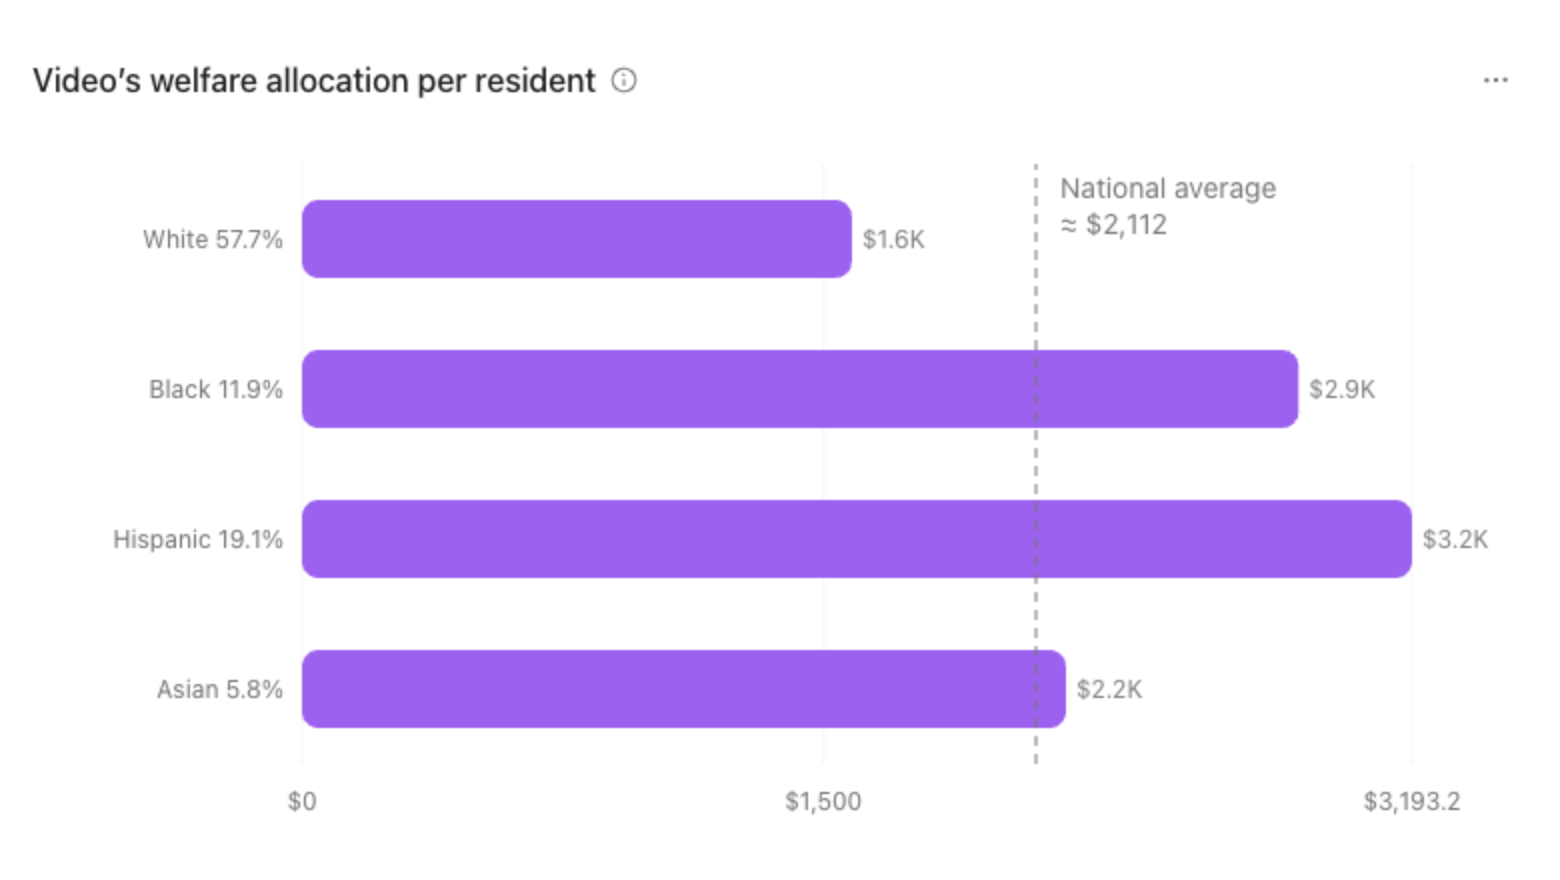
Each group’s label includes its percentage of the U.S. population. The dashed benchmark is the full $703.90 billion budget divided by the full ACS population of 333,287,562 residents: approximately $2,112 per resident.
Population share versus allocated spending share
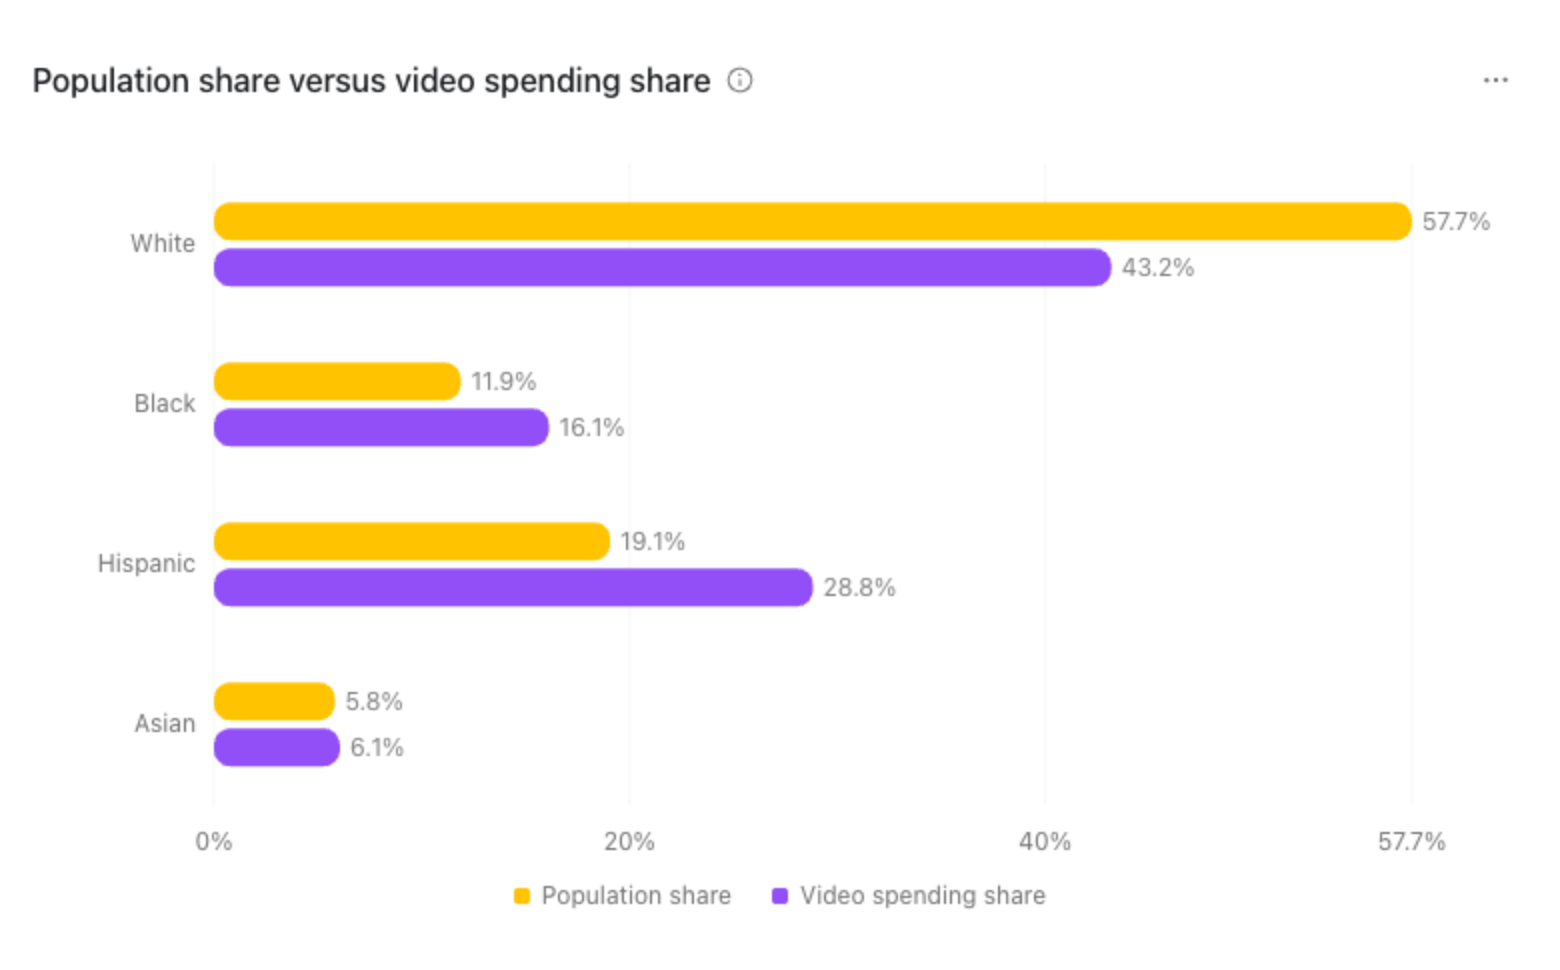
Population shares use the full U.S. population; spending shares use the full $703.90 billion welfare total. Neither series is rescaled to make these four groups sum to 100%.
| Assumed group definition | 2022 population | Population share | Video allocation | Share of full welfare total | Allocation per resident |
|---|---|---|---|---|---|
| White, non-Hispanic, race alone | 192,153,076 | 57.65% | $303.95bn | 43.18% | $1,582 |
| Black, non-Hispanic, race alone | 39,582,961 | 11.88% | $113.50bn | 16.12% | $2,867 |
| Hispanic, any race | 63,553,639 | 19.07% | $202.94bn | 28.83% | $3,193 |
| Asian, non-Hispanic, race alone | 19,415,251 | 5.83% | $42.67bn | 6.06% | $2,198 |
Method: allocated dollars ÷ group population; population share = group population ÷ 333,287,562; spending share = allocated billions ÷ 703.90. Ratios use unrounded calculations. Under the stated category assumption, the Black allocation is approximately 1.81 times the White allocation per resident. This arithmetic does not independently validate the underlying spending model.
Unassigned remainder: the four displayed allocations sum to $663.06 billion, leaving $40.84 billion (5.80%) of the row’s total unassigned. It has not been attributed to an “other” population because the video’s residual classification is unknown. The four selected population categories also exclude other non-Hispanic racial groups and multiracial people.
Sources and status: welfare amounts transcribed from the video’s first fiscal table at 4:25, credited on screen to “@WhitePapersPol 2026. Data from 2022”; population point estimates from Census B03002 above. Chart calculations and images prepared October 7, 2026. These graphics illustrate how the video’s welfare row changes after population adjustment; they do not upgrade the row’s source-verification status.
4:25 — fiscal utilization
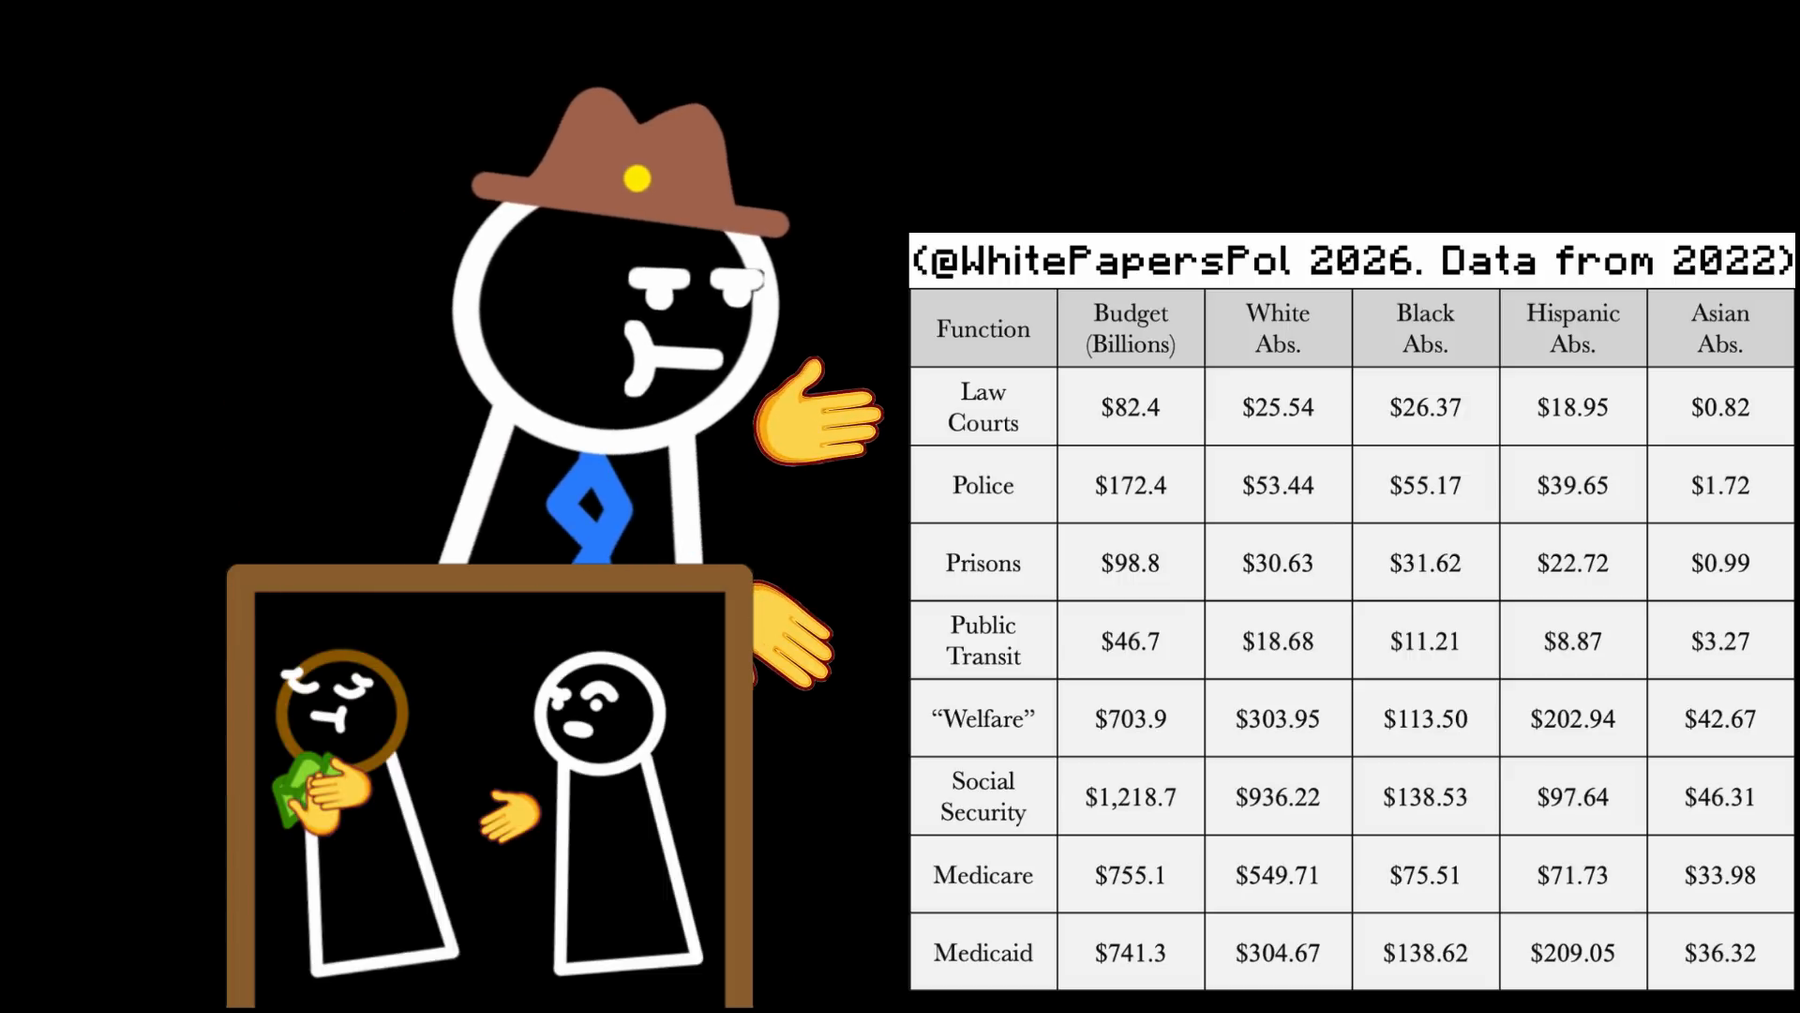
First fiscal table, including courts, police, prisons, transit, welfare, Social Security, Medicare and Medicaid. C049–C055/C113. Full transcription and denominator audit above.
| Screen group | Variable cost | Equal-cost allocation | Total cost | Tax revenue | Net contribution |
|---|---|---|---|---|---|
| White | 2,222.84 | 3,465.41 | 5,688.25 | 5,819.46 | +131.21 |
| Black | 590.52 | 713.89 | 1,304.41 | 633.92 | −670.49 |
| Hispanic | 671.57 | 1,146.20 | 1,817.77 | 1,227.31 | −590.46 |
| Asian | 166.09 | 350.16 | 516.25 | 897.00 | +380.75 |
4:47 — fiscal balance
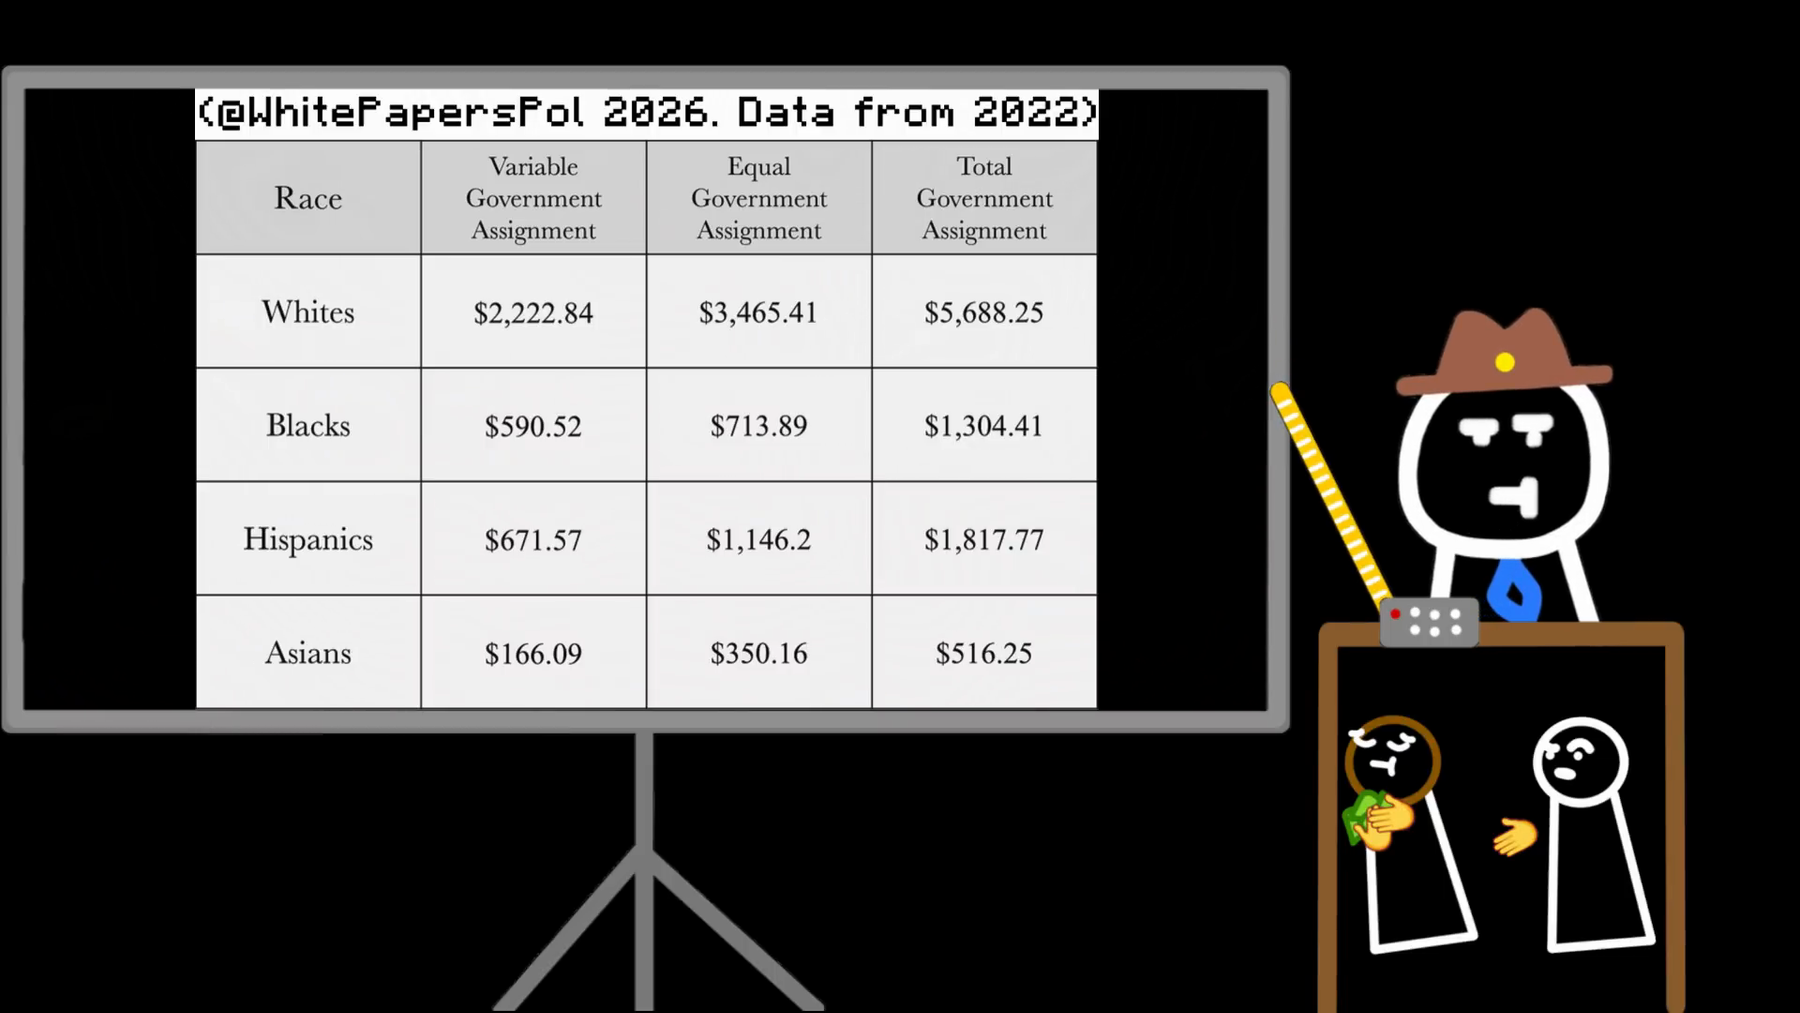
Variable costs, equal-cost allocation and total costs. C056–C058. Per-capita attribution is an accounting convention requiring justification.
What can be reproduced
| Operation | Result | What it establishes |
|---|---|---|
| 670.49 / 131.21 | 5.110 | Ratio between two displayed net balances |
| 670.49 / 1,375 | 48.76% | Conditional magnitude comparison with Treasury’s FY2022 deficit |
Treasury reports federal FY2022 receipts of $4.896T, outlays $6.272T and deficit $1.375T. The screen’s four spending columns sum to $9.32668T and taxes to $8.57769T; their net is −$748.99bn. Those are not a federal-budget decomposition. A scale comparison is still possible, but “this amount equals about half the deficit” must not become “this racial group caused half the federal deficit.” The original scope and reconciliation remain missing. [S13–S14]
IRS does not collect race/ethnicity on returns, but Treasury performs racial incidence research using imputation. That makes race-specific analysis possible, with uncertainty; it does not make this particular calculation simple or verified. The screen’s court/police/prison allocations are approximately 31% White, 32% Black, 23% Hispanic and 1% Asian, totaling about 87%. Omitted groups might explain the remainder; missing shares alone do not demonstrate error. The equal-cost column implies a Black share about 12.58%, while the narration uses 14%. Definitions must be reconciled before treating these as one population model. [S12, S14, S16]
4:54 — fiscal net
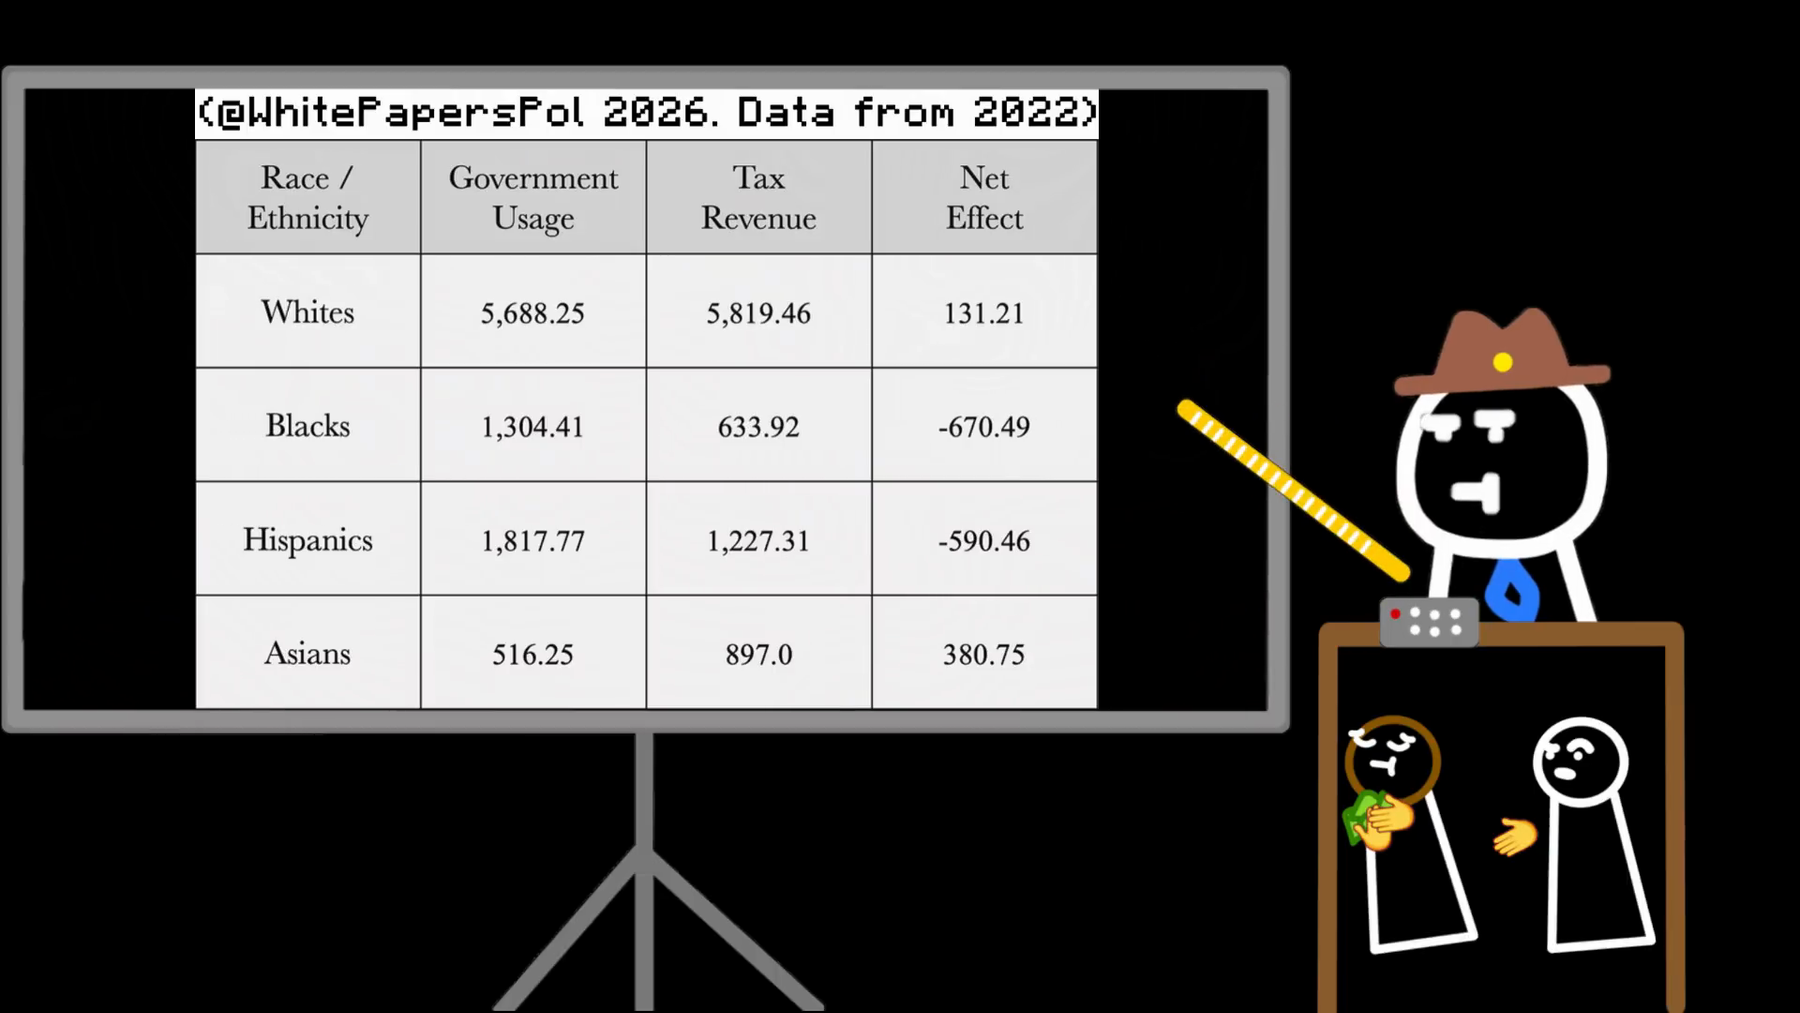
Tax revenues and net balances. C058–C060. Arithmetic can be checked while inputs remain unverified.
Detailed claim checks
| ID / time | Atomic claim | Verdict | Evidence and limit | Source IDs |
|---|---|---|---|---|
| C045 3:52 | Net fiscal contribution is taxes minus allocated public costs. | Supported definition | The definition is coherent; the incidence assumptions determine its empirical meaning. | S12–S13 |
| C046 3:58 | IRS does not collect contributors’ racial identities. | Supported with scope | Race/ethnicity are not collected on tax returns; Treasury can nevertheless study imputed racial incidence. | S12 |
| C047 4:01 | IRS does not publish each racial group’s net contribution. | Mostly supported with scope | No standard comprehensive racial net-fiscal series was identified; do not expand this to no official race-related tax research. | S12 |
| C048 4:04 | It is quite easy to calculate from public information. | Misleading | Tax imputation, public-goods allocation, eligibility, age and government levels require substantive assumptions and uncertainty estimates. | S12–S13 |
| C049 4:09 | The displayed figures include welfare. | Supported as screen content | The row is visible; its underlying classification and inputs remain unrecovered. | S01, S14 |
| C113 4:09 | Fiscal tables credit @WhitePapersPol 2026 using 2022 data. | Supported attribution; inputs unresolved | The credit is visible. No original 2026 worksheet or reproducible methodology was recovered. | S01, S14 |
| C050 4:15 | They also include policing. | Supported as screen content | A policing row is visible; allocating costs is not the same as estimating benefits or crime caused. | S01, S14 |
| C051 4:19 | Black Americans are about 14% of the population. | Mostly supported with scope | 2020 Census Black alone-or-in-combination was 14.2%, versus 12.4% Black alone; model category consistency is unresolved. | S16 |
| C052 4:21 | Black policing costs exceed every other group. | Unverifiable estimate | True of displayed allocations, not independently verified causal costs. The spreadsheet’s allocation method was not recovered. | S14 |
| C053 4:23 | Black court costs exceed every other group. | Unverifiable estimate | The screen assigns the largest shown column to Black Americans; same methodological limit. | S14 |
| C054 4:23 | Black prison costs exceed every other group. | Unverifiable estimate | Displayed ranking is visible; spending incidence cannot simply be equated with recipient benefit or intrinsic group liability. | S14 |
| C055 4:28 | Black Americans are overrepresented in nearly every other category. | Misleading even within chart | Against 14%, only three of five non-criminal-justice rows exceed that share; Social Security and Medicare do not. | S14 |
| C056 4:33 | Fixed government costs do not vary by identity. | Unsupported simplification | A cost held fixed in an accounting model need not have identical benefit incidence or zero behavioral response. | S14 |
| C057 4:36 | Allocating those costs per capita is fair. | Normative convention | Equal average allocation is one model, not a uniquely demonstrated fairness or marginal-cost principle. | S14 |
| C058 4:44 | Estimated taxes and assigned spending yield the shown balances. | Conditional arithmetic supported | Subtraction works; the tax estimates and spending allocations are not independently reproduced. | S14 |
| C059 4:49 | Black net deficit exceeds five times the White surplus. | Conditional arithmetic supported | 670.49/131.21=5.110; this certifies the ratio of displayed numbers only. | S14 |
| C060 4:53 | It equals nearly half the 2022 federal deficit. | Conditional scale comparison supported | 670.49/1,375=48.76%. It is not a demonstrated decomposition or causal share of the federal deficit. | S13–S14 |
4:58–5:17 — The household bill and lifetime debt
Main claim and assessment
The household bill follows conditionally from the displayed numerator and assumed household count. Neither the underlying liability nor the lifetime extrapolation is established.
The annual calculation and its assumptions
| Operation | Result | What it establishes |
|---|---|---|
| $670.49bn / 16m | $41,905.625 | Conditional equal allocation, rounded about $41,906 |
| $670.49bn / 18.080m | $37,084.62 | Household-denominator sensitivity only; not a corrected debt |
| $1,304.41bn / 16m | $81,525.625 | Screen’s gross cost allocation per assumed household |
| $590.52bn / 16m | $36,907.50 | Screen’s variable-cost allocation per assumed household |
Finally, a lifetime claim needs age profiles, tax trajectories, mortality, discounting, cohort changes and policy assumptions. Multiplying one selected year’s net balance is not such a model. Historical discriminatory conduct and public transfers can coexist; neither existence alone identifies the cause of a national racial fiscal gap.
5:09 — household bill

The $41,905 annual equal-allocation figure. C061–C063/C069–C070. This is a net shortfall per assumed household, not gross services received.
Detailed claim checks
| ID / time | Atomic claim | Verdict | Evidence and limit | Source IDs |
|---|---|---|---|---|
| C061 4:58 | There are 16 million Black households. | Misleading/underspecified | Census’s matching 2022 income report reports 18.080 million Black households; source and vintage of 16 million are absent. | S15 |
| C062 4:58 | Equal billing would be $41,905 per household for one year. | Conditional arithmetic mostly supported | 670.49bn/16m=$41,905.625, approximately $41,906 rounded. Neither numerator nor liability is established. | S14–S15 |
| C063 5:12 | Lifetime debt would easily reach hundreds of thousands. | Unsupported projection | No cohort, age, tax, discounting or life-cycle model supplied. A one-year allocation is not a lifetime debt estimate. | S14 |
5:17–5:54 — Racism, poverty, and services received
Main claim and assessment
The narration substitutes a net fiscal shortfall for services received. Transfers can coexist with discrimination, and direct records and experiments provide evidence beyond aggregate disparities.
Why the inference to benefits and debt fails
The narration then describes the net gap as services received. Even its own model distinguishes net balance from gross allocation. Public goods can be assigned by equal average cost, marginal cost, benefit incidence or other conventions; the preferred convention needs justification. A progressive tax system deliberately redistributes by income and life stage. Neither being a net recipient nor being assigned a prison cost establishes wrongful conduct, legal liability or who receives compensation.
Census’s 2022 income report gives 18.080 million Black households and a non-Hispanic White median household income of $81,060. The latest 2025 figure is $96,710. The video’s $94,000 lacks a year, mean/median definition and racial scope. Those figures do not validate a comparison between household income and allocated public costs, even after matching dates. [S15]
The claim that researchers merely assume discrimination from population disparities is also false as a generalization. Correspondence experiments randomize race-signaling names on matched applications. DOJ’s Ferguson investigation identified financial incentives, unconstitutional enforcement, discretionary practices and direct biased communications. These establish particular mechanisms, not the national fraction of poverty or crime caused by racism. [S17–S19]
Detailed claim checks
| ID / time | Atomic claim | Verdict | Evidence and limit | Source IDs |
|---|---|---|---|---|
| C064 5:17 | A common rebuttal is racism causes poverty and crime. | Oversimplified attribution | No named opponent’s full argument is tested; several mechanisms and outcomes are compressed into one chain. | S01, S17–S19 |
| C065 5:23 | Discrimination can increase poverty. | Mechanism supported; magnitude open | Matched-applicant experiments and documented official practices establish opportunity restrictions, not the national share of poverty explained. | S17–S19 |
| C066 5:26 | Lower income reduces tax revenue. | Mostly supported conditional | Generally true for taxable income under the schedule; not a complete explanation of all taxes or the racial fiscal table. | S12 |
| C067 5:26 | Poverty increases crime. | Unresolved causal claim here | Outcome-specific causal evidence is needed; the displayed wealth/incarceration comparison cannot settle this question. | S20 |
| C068 5:30 | White households earn about $94,000 annually. | Unverifiable as specified | Mean/median, race definition and year omitted. 2022 White non-Hispanic median was $81,060; latest 2025 $96,710. | S15 |
| C069 5:32 | Black households receive nearly half White income in services. | Misleading quantity substitution | $41,905 is the model’s net shortfall, not gross services received. The White-income comparison also mixes undefined vintages. | S14–S15 |
| C070 5:38 | Those services are received just for existing. | Misleading | Police, court and imprisonment allocations are not household cash benefits; public spending has eligibility, need and institutional purposes. | S14 |
| C071 5:40 | Such services contradict a racist oppressive system. | Unsupported inference | Public transfers and discriminatory conduct can coexist across different institutions. | S17–S19 |
| C072 5:45 | No consistent legal mechanism systematically holding Black people back has been provided. | Misleading/false as a blanket claim | Documented police/court mechanisms exist, including unlawful practices within legal institutions; openly discriminatory statutes are a narrower question. | S17 |
| C073 5:50 | Proponents only infer discrimination from group disparities. | False as a generalization | Randomized matched-résumé experiments and direct official records provide evidence beyond aggregate disparities. | S17–S19 |
6:00–6:18 — Wealth, incarceration, and the poverty explanation
Main claim and assessment
The highest-wealth-bracket comparison does not match the cited study. Incarceration, crime commission, wealth and income are different measurements.
Crime, incarceration, and denominator audits
The crime sequence continues in the next three sections, with the original studies and chart qualifications placed beside the corresponding claims.
Wealth and incarceration
Zaw, Hamilton and Darity’s Table 6 uses 1985 wealth and observed incarceration during 1986–2012. The highest Black male decile is 2.43% (N=37); the lowest White male decile 2.70% (N=162). Black men in the next-highest decile are 9.65% (N=38). The highest-decile sample is too small for a confident population reversal. The narration’s top-bracket 10% claim is therefore mismatched to the original table, and its substitution of crime for incarceration adds another error. This observational comparison does not identify poverty’s causal effect. [S20]
6:17 — wealth incarceration
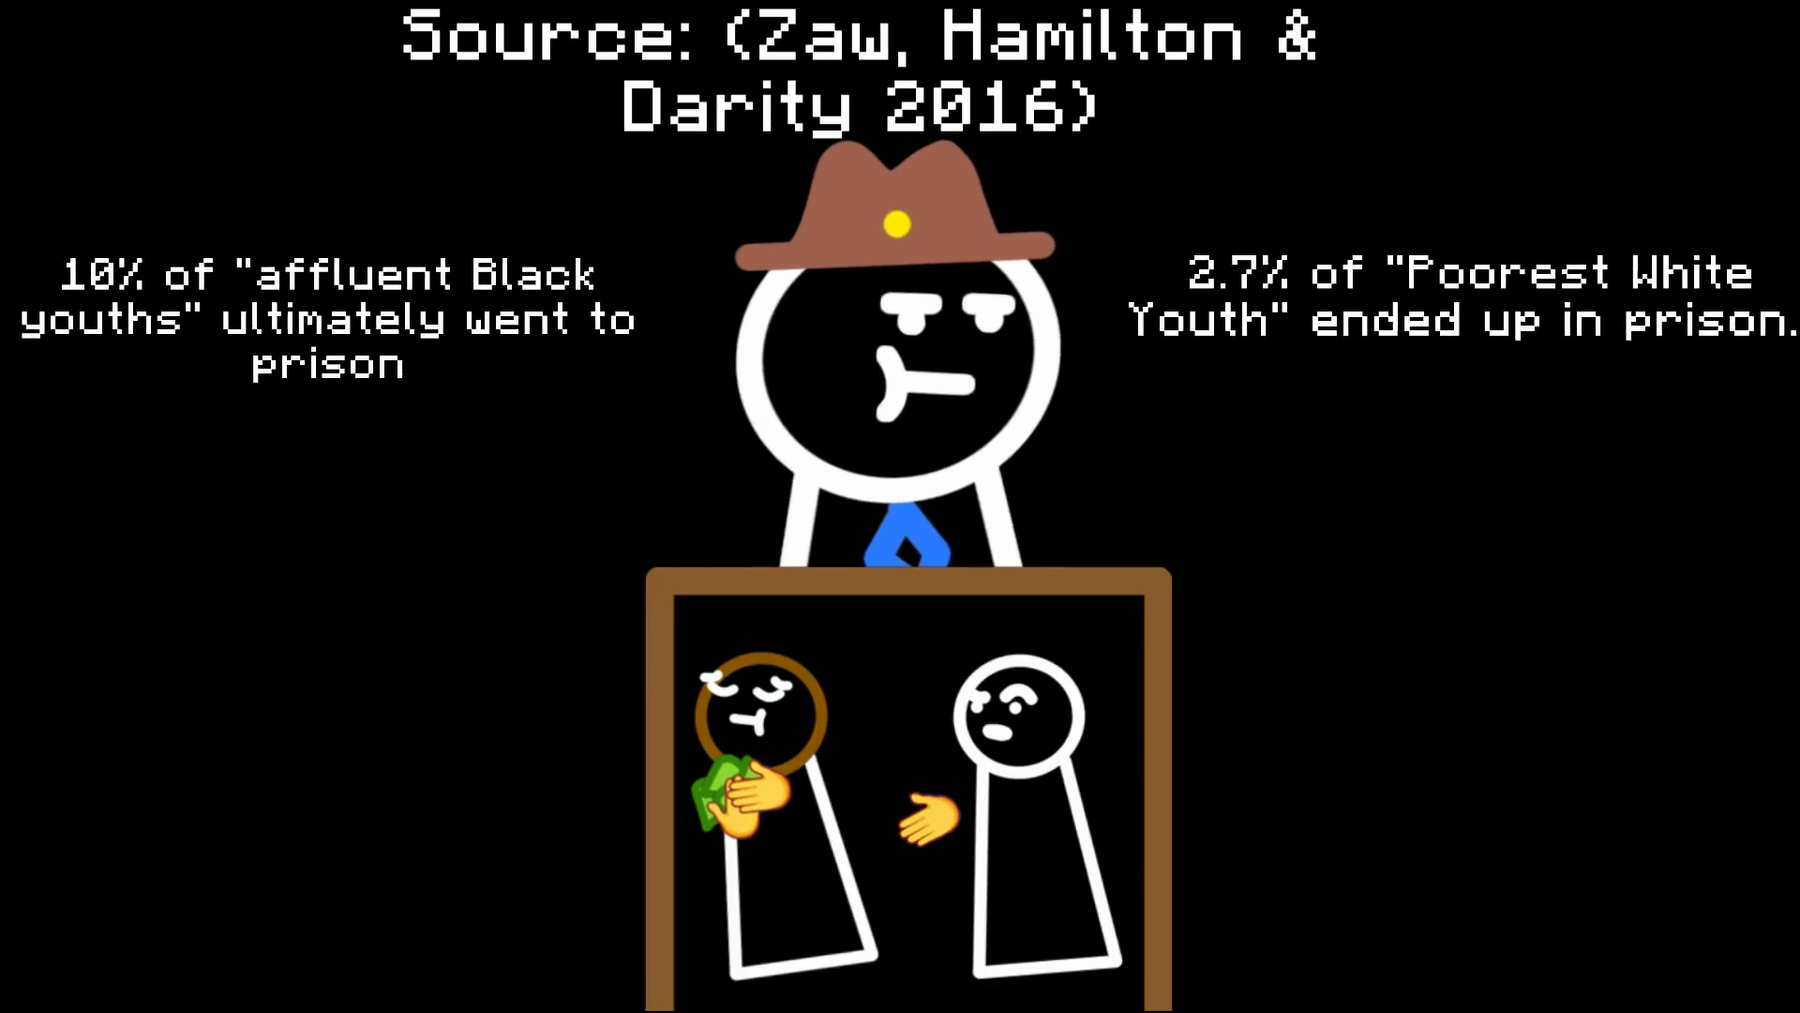
Zaw 2016 graphic claiming about10% affluent Black youth versus2.7% poorest White youth. C074–C076/C114–C115. Compare original Table 6 and highest-decile/sample qualifications above.
Detailed claim checks
| ID / time | Atomic claim | Verdict | Evidence and limit | Source IDs |
|---|---|---|---|---|
| C074 6:00 | Criminal behavior tracks identity better than income. | Unsupported inference | No predictive comparison with appropriate covariates is supplied; wealth is not income and incarceration is not crime commission. | S20 |
| C075 6:07 | Highest-wealth Black people commit more crime than poorest Whites. | False as stated from cited evidence | The original top-decile estimate is not the displayed 10%, and incarceration does not measure all offending. | S20 |
| C076 6:13 | That proves the poverty explanation wrong even assuming racism. | Unsupported causal inference | Between-group observational differences do not identify the causal effect of poverty. | S20 |
| C114 6:17 | About 10% of affluent Black youth were incarcerated. | Misleading bracket/age framing | Original nearest figure is 9.65% in the next-highest wealth decile, not 2.43% in the highest; observation extends into adulthood. | S20 |
| C115 6:17 | Poorest White youth incarceration was 2.7%. | Supported number; scope qualified | 2.70% matches Table 6’s lowest male wealth decile; 1985 wealth and 1986–2012 incarceration are not a contemporary youth crime rate. | S20 |
6:23–6:43 — Felony records, homicide, and interracial comparisons
Main claim and assessment
Several narrow descriptive findings have sources, but their year, outcome and denominator matter. The elevenfold adjustment is not automatically a comparison of victims’ risks.
Felony history and homicide
Shannon et al.’s estimate is 33.01% of adult African American men with current or past felony convictions in 2010, based on demographic modeling. Conviction history, violent offending, current imprisonment and current crime rates are different quantities. [S21]
The homicide heatmap was traced to datahazard / @fentasyl, whose 2023 article transforms FBI NIBRS 2021 estimation data and Census denominators. The screen shows 5.8 Black-female versus 3.5 White-male offenders per 100,000 (65.7% higher); ages 15–64, 8.7 versus 5.2 (67.3% higher). These are the analyst’s estimates, not a directly published FBI race-by-sex rate table. His thread describes arrest-based inputs, acknowledges less robust female estimates, and uses assumptions to separate Hispanic people from the FBI White category. The exact original 2022-vintage input file, transformation code and matching denominators remain unreproduced. The currently available official 2021 indicator archive was recovered in the follow-up, including joint race-by-sex arrest tables; recovery of that archive does not establish reproduction of the video’s chart. NIBRS raw coverage was 65.7% in 2021, but national estimates adjust for nonreporting, so raw coverage alone does not disprove them. [S22–S23, S36]
Correction to the earlier chat framing: the FBI does collect homicide-offender race and sex, separately from murder-arrest records. Underlying Supplementary Homicide Report (SHR) records allow race and sex to be counted together. Some published summary tables display separate race and sex totals rather than the joint categories needed here. Arrest counts alone do not settle the video’s offender-rate comparison. [S37]
Latest annual comparison — 2025 FBI records
Finding: in the 2025 SHR annual master file, White males including Hispanic White males have a higher recorded murder-offender rate than Black females: 4.01 versus 3.18 per 100,000, approximately 26.0% higher. The video’s narrower comparison with non-Hispanic White males depends on missing-ethnicity assumptions. This newer comparison does not retrospectively prove or disprove the exact 2021 chart. [S37–S39]
| Group, all ages | Recorded murder-offender entries | July 1, 2025 population | Entries per 100,000 of that group |
|---|---|---|---|
| White males, including Hispanic White males | 4,896 | 122,145,300 | 4.0083 ≈ 4.01 |
| Black females, all ethnicities | 769 | 24,172,990 | 3.1812 ≈ 3.18 |
Formula: recorded offender entries ÷ matching group population × 100,000. Children are included in both denominators. Population categories are Census White alone, male and Black alone, female. These are crude rates, not age-standardized comparisons. [S38]
Excluding Hispanic White males
Among 4,896 White-male offender entries, 1,697 are explicitly non-Hispanic, 1,807 Hispanic, and 1,392 (28.4%) have unknown or blank ethnicity. The non-Hispanic White-alone male population is 94,527,292. [S37–S38]
| Treatment of the 1,392 missing-ethnicity White-male entries | Non-Hispanic White-male numerator | Rate per 100,000 non-Hispanic White males | Interpretation |
|---|---|---|---|
| Count only explicitly non-Hispanic entries | 1,697 | 1.7952 ≈ 1.80 | Incomplete observed numerator; not a complete offending estimate |
| Allocate missing ethnicity in the proportions of known ethnicity | 4,896 × 1,697 ÷ (1,697 + 1,807) = 2,371.15 | 2.5084 ≈ 2.51 | Assumption-based proportional estimate, not an FBI-published estimate |
| Assign all missing White-male ethnicity to non-Hispanic | 3,089 | 3.2678 ≈ 3.27 | Sensitivity ceiling for ethnicity assignment among recorded White-male entries |
Conditional conclusion: using 2.51 versus 3.18, Black females have an estimated per-capita recorded murder-offender rate approximately 26.7% higher; using unrounded inputs gives 26.8%. This is a higher rate relative to population size, not more offenders in total. A precise statement is: “In the 2025 FBI SHR records, Black females had a recorded murder-offender rate approximately 27% higher than the estimated rate for non-Hispanic White males, assuming missing White-male ethnicity follows the same proportions as known ethnicity.”
Uncertainty: the ethnicity-assignment range 1.80–3.27 crosses the Black-female rate 3.18. Consequently, the annual master file does not conclusively establish which group’s rate is higher when White excludes Hispanic. This range is not a confidence interval or a bound on actual national offending. Missing ethnicity can be systematic; proportional allocation is an assumption rather than a demonstrated correction. A statement simply asserting that Black women “murder more than White men” omits ethnicity, year, per-capita scope, and the estimation assumption.
What was counted and what remains uncertain
- Source and date: latest annual release found was 2025, released August 14, 2026; annual SHR master file retrieved October 7, 2026. The live CDE dashboard was separately checked and reports a September 15, 2026 refresh; it has different totals. The rates above specifically use the downloadable annual master file, not a blend with live dashboard figures. [S37, S39]
- Counting: fixed-length 268-character records; exclude division 0 territories, homicide types other than murder/nonnegligent manslaughter, and justifiable-homicide circumstances 80/81. Count the first offender and additional offender slots. Retained records contain 12,406 incidents, 13,375 victims, and 16,632 available offender entries, including entries with unknown demographics. The file format holds at most 11 offenders per incident; 11 additional entries exceed that capacity and have no recoverable demographic slots.
- Meaning: these are police-recorded offender involvements, not arrests, convictions, deduplicated unique people, or a complete census of all actual murder offending. Multiple offenders can participate in one killing; one offender can be linked to multiple victims or incidents. Unknown race/sex entries are excluded from group numerators, and no national nonresponse weighting or unknown-offender imputation is applied. Administrative race coding and Census race self-identification are not perfectly harmonized.
- Source consistency: the FBI annual summary tables, annual master file and refreshed live API differ. The accompanying FBI README explains differences in quality criteria and methodologies between publication tables, master files and dashboards. These results identify the source version rather than claiming all FBI displays match.
- Interpretation: neither these rates nor the video’s modeled rates establish causes of group differences, individual propensity, or collective fiscal liability.
Vault-visible evidence and reproducibility: Detailed calculation and method, Attachment (file not included in this release), Attachment (file not included in this release), Attachment (file not included in this release), and Attachment (file not included in this release). [S37–S39]
“Projected lifetime” is an age-band sum under constant period rates. The Black-female 423 per 100,000 follows 16.9×10 +13.3×10 +3.9×30 +0.4×10. It is not an observed cohort probability. Survival, repeat offending and unique-person versus event definitions are necessary to interpret it. [S22]
6:35 — homicide table
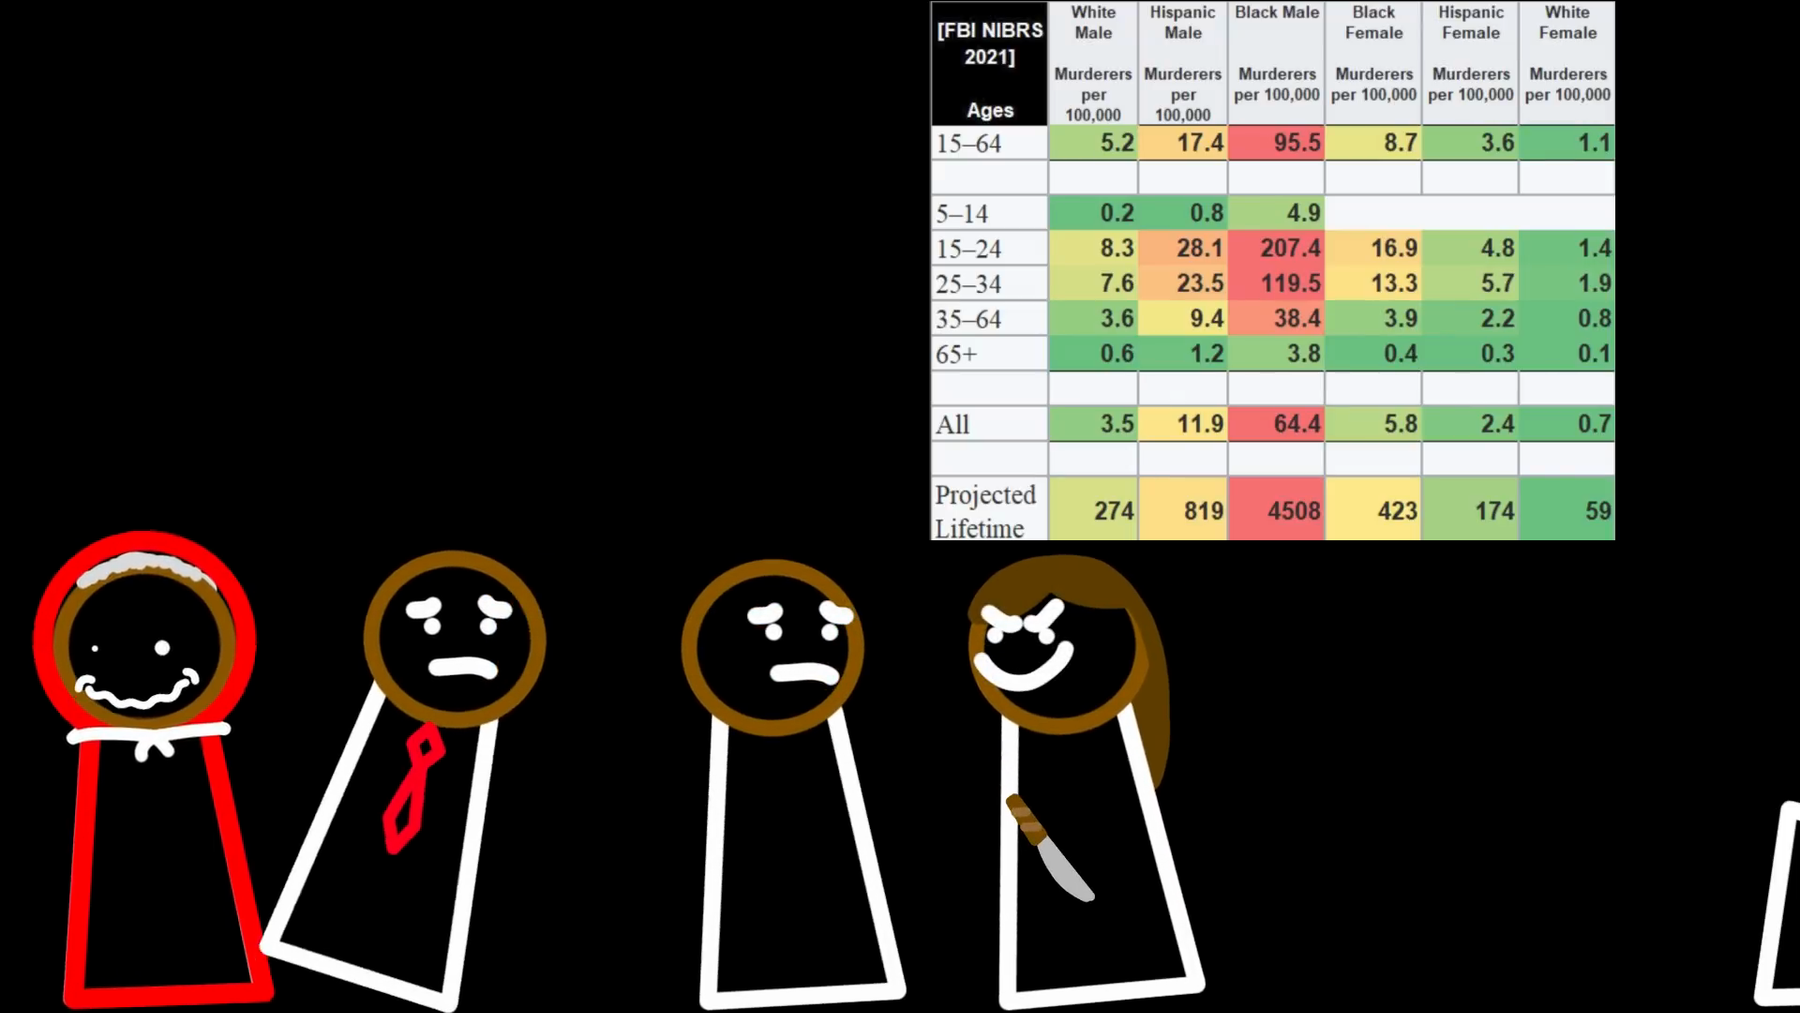
Analyst-derived 2021 age/race/sex heatmap and lifetime projections. C078/C116–C117. Exact reproduction remains partial; the FBI label omits the transformation layer.
Interracial homicide: two different per-capita questions
FBI 2019 Table 6 covers single-victim/single-offender cases. White victims/Black offenders=566; Black victims/White offenders=246. Their count ratio is about2.3. White here is the FBI race category, which includes Hispanic people. If W and B denote matching population counts:
Offender-group rate ratio: (566/B) / (246/W) = 2.3008 × W/B
Victim-group risk ratio:   (566/W) / (246/B) = 2.3008 × B/W
A value near11 can arise in the first calculation for W/B≈4.78; the second asks a different question and moves in the opposite direction. The video does not supply enough population inputs to certify its exact11. It must not be presented ambiguously as White victims’ relative risk. The table also supports predominantly same-race homicide victimization, without verifying every other crime type. [S24]
Detailed claim checks
| ID / time | Atomic claim | Verdict | Evidence and limit | Source IDs |
|---|---|---|---|---|
| C077 6:23 | One-third of adult Black men have a felony. | Mostly supported only as dated estimate | Shannon et al. estimate 33.01% with current/past felony convictions in 2010; not a measured 2026 offending rate. | S21 |
| C078 6:26 | Black women’s murder rate exceeds White men’s. | Conditional estimate; exact 2021 rates unresolved | The displayed analyst-derived 2021 table says so; original 2021 transformation remains unreproduced. Latest 2025 recorded rates: White males including Hispanic 4.01 vs Black females 3.18; non-Hispanic White males 2.51 only with proportional missing-ethnicity allocation (sensitivity 1.80–3.27). | S22–S23, S36–S39 |
| C079 6:30 | Most victims of Black crime are Black. | Partly supported; overbroad | Same-race predominance is supported for the inspected homicide subset; all crime types are a broader unverified claim. | S24 |
| C080 6:34 | There is enormous spillover onto other groups. | Evaluative/underspecified | Interracial homicide exists; ‘enormous’ needs a defined harm metric, comparison and period. | S24 |
| C116 6:35 | The NIBRS table shows Black women above White men. | Supported screen content; partial source verification | The rates are a commentator’s transformation of FBI estimation data, not an independently reproduced FBI-published table. New 2025 SHR findings are a separate year and estimand; see the latest annual comparison above. | S22–S23, S36–S39 |
| C117 6:35 | Projected lifetime values are 423 versus 274 per 100,000. | Projection only; potentially misleading | An age-band rate sum under constant 2021 rates is not observed lifetime cohort risk or necessarily distinct offenders. | S22 |
| C081 6:36 | Black-on-White murders are 2.3 times the reverse. | Supported for restricted 2019 table | 566/246=2.3008 for single-victim/single-offender cases with identified race, not all years or all homicide cases. | S24 |
| C082 6:40 | Per capita that becomes nearly 11 times as likely. | Misleading denominator ambiguity | An offender-population ratio differs from victim risk; exact population inputs and matching racial definitions are absent. | S24 |
6:45–7:06 — Floyd, White victims, and social movements
Main claim and assessment
The implied overdose-only account conflicts with the official causation record. The movement and victimization comparisons also need defined periods, populations and propositions.
Floyd and social movements
The “overdoses near a cop” description implicitly refers to George Floyd. Chauvin’s signed federal plea admits excessive force and failure to render aid caused death, including interference with adequate oxygen. Drug findings do not make the restraint merely coincidental. The appellate record supports this distinction; direct autopsy retrieval was access-limited. [S25]
The separate movement claim needs care. BLM’s own history dates its founding to2013; Floyd’s killing intensified2020 mobilization. The transcript does not literally say “BLM was founded in 2020.” Nor does evidence that some people committed arson establish that all protesters endorsed it. “No movement whatsoever” for White victims is too absolute and underspecified. White Lives Matter campaigns exist, with documented White-supremacist adoption; that history explains an association without establishing every speaker’s intent or the rate of social/employment consequences. [S27–S28]
Related: Why Is Per Capita Impossible For Them, Why Is Black America Like That, Crime, and Basic Logic Fact-Check Method > Crime statistics.
6:58 — victim collage

Victim imagery accompanying the social-movement comparison. C083–C090. Iryna Zarutska is visibly named; other pictured people are not identified from faces. Selected images are not a representative victimization sample.
Detailed claim checks
| ID / time | Atomic claim | Verdict | Evidence and limit | Source IDs |
|---|---|---|---|---|
| C083 6:45 | The implied Floyd death was merely an addict overdosing near a cop. | False | Chauvin admitted excessive force and failure to aid caused death; drug findings do not establish overdose-only causation. | S25 |
| C084 6:49 | That death was viewed as just cause to burn cities. | Unsupported generalization | Some arson does not establish movement-wide justification; protests, violence and endorsement require separate evidence. | S01, S27 |
| C085 6:49 | Whole movements start after such deaths. | Misleading/ambiguous chronology | Floyd catalyzed 2020 mobilization; BLM’s own founding account dates to 2013. The transcript does not explicitly date BLM’s founding. | S27 |
| C086 6:53 | White victimization is vastly more common. | Unverifiable comparison | Type, period, population and comparator unspecified; civilian crime totals versus one police killing are not comparable rates. | S24–S25 |
| C087 6:53 | There is no movement whatsoever for White victims. | Unsupported absolute | Racially branded campaigns exist; whether a particular victim mobilizes protest needs case-specific evidence. | S28 |
| C088 6:59 | White Lives Matter is treated as a racist dog whistle. | Partly supported with context | Organized White-supremacist adoption is documented; this does not establish every individual speaker’s intent. | S28 |
| C089 7:02 | Saying it can cause social ostracism. | Plausible but unquantified | No rate, defined context or documented case supplied; not established as a general empirical effect. | S28 |
| C090 7:04 | Saying it can hurt employment opportunities. | Plausible but unverified here | A concrete employment case and causal evidence would be needed; the source on slogan history does not establish prevalence. | S28 |
7:08–7:14 — Rape and sexual-assault comparison
Main claim and assessment
The displayed survey cells are sparse estimates with a visible warning. A weighted zero cannot establish that no real cases occurred or justify a stable extreme ratio.
NCVS rape and sexual assault
The underlying source is NCVS 2008 Table 42, not contemporary police-recorded rape counts. Its single-offender rape/sexual-assault estimates include verbal threats and perceived offender race. The shown interracial cells are flagged as based on 10 or fewer sample cases. Rounded published cells yield about19,293, close to the screen’s19,283, and 0.0% for the reverse estimate; exact unrounded input was not recovered. A weighted survey zero is not proof of no real cases. The video visibly includes the small-sample warning, but its narration invites a stronger racial comparison than these sparse estimates support. [S29]
7:12 — rape table
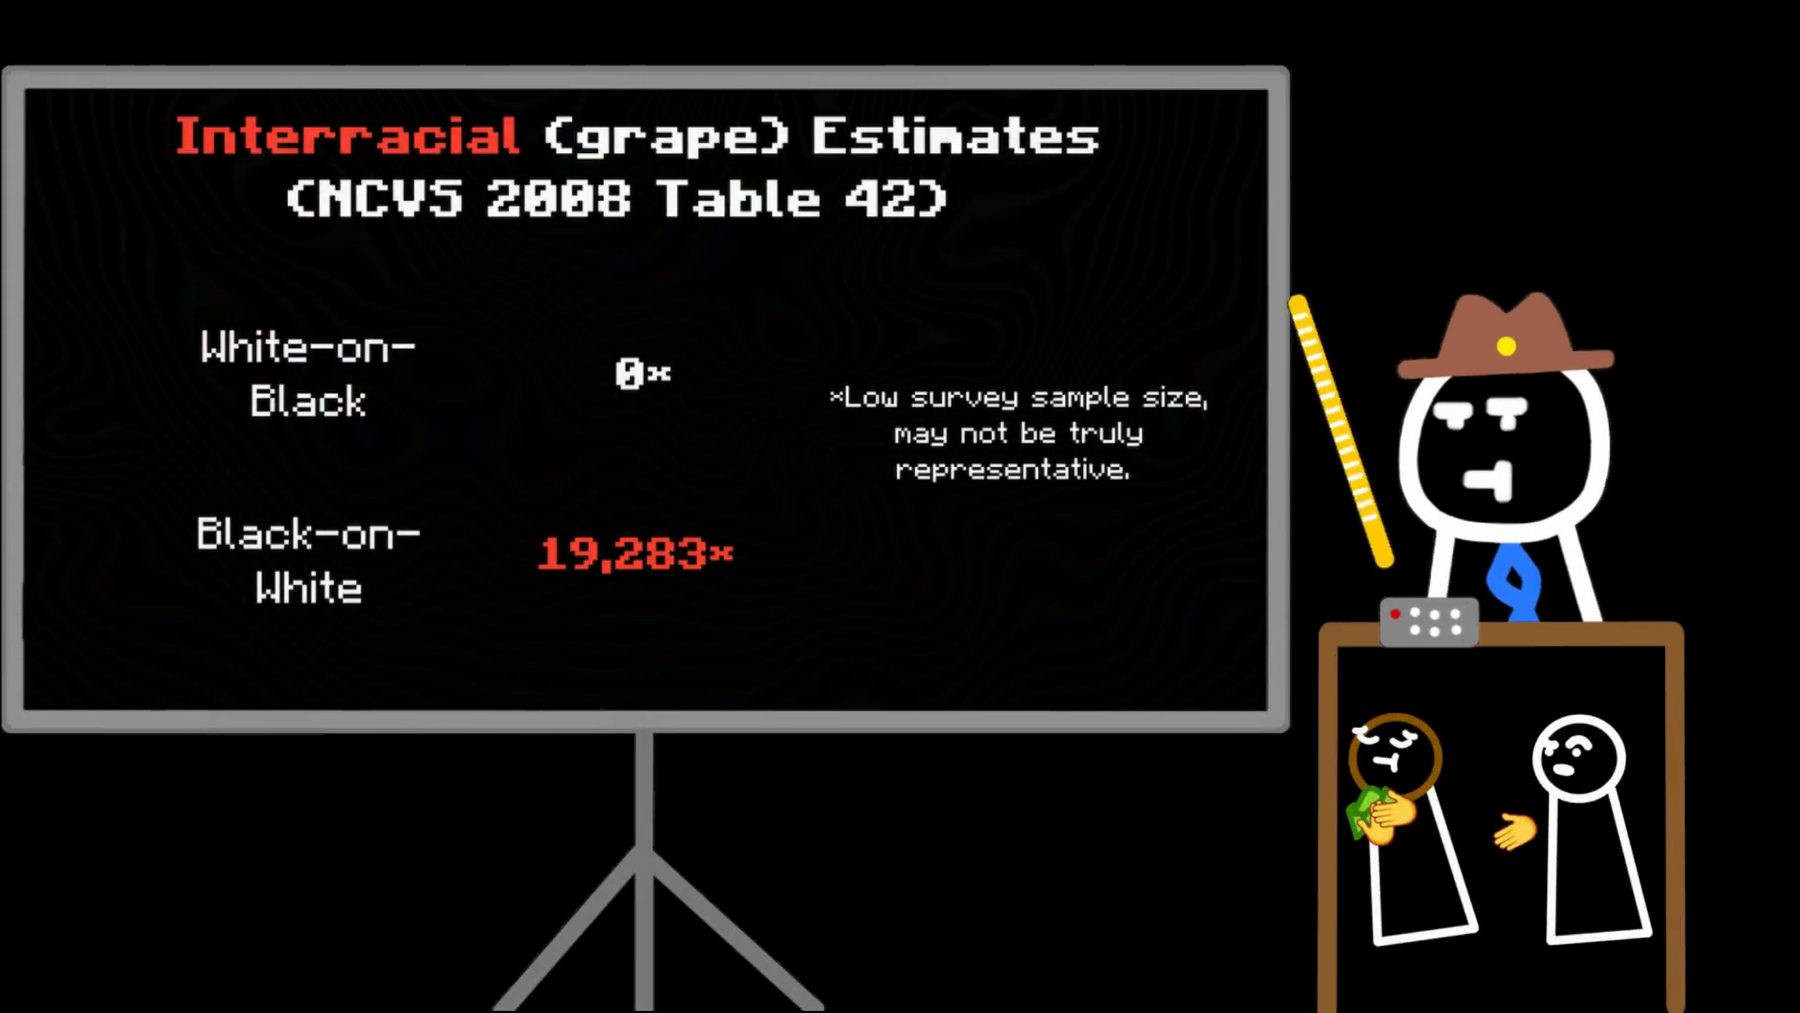
NCVS 2008 interracial rape/sexual-assault estimates. C091/C118. The low-sample warning is present on screen and must be retained in interpretation.
Detailed claim checks
| ID / time | Atomic claim | Verdict | Evidence and limit | Source IDs |
|---|---|---|---|---|
| C091 7:08 | Some interracial crime differences are even more extreme. | Misleading use of sparse estimates | The shown NCVS cells have very small samples and a weighted zero; they cannot support a stable extreme or infinite ratio. | S29 |
| C118 7:12 | NCVS 2008 shows 19,283 Black-on-White rapes versus zero in reverse. | Misleading precision/zero interpretation | Sparse single-offender rape/sexual-assault estimates, including threats; weighted zero is not no real cases. Caveat is visibly present. | S29 |
7:14–8:00 — DEI, IQ, performance, and hiring
Main claim and assessment
The displayed studies report descriptive differences, not an identified DEI treatment effect. Occupational averages cannot identify the full qualifications of individual hired or rejected applicants.
Employment, DEI, and civil-rights law
Roth, Huffcutt and Bobko’s Table 4 reports within-job performance-rating differences: observed d=.23, corrected d=.30, K=19, N=3,855 (White2,601; Black1,254), 90%CI .18–.29. This is a standardized difference, not a23% productivity loss. The paper also reports objective-measure differences; it should not be dismissed wholesale as rater bias. The displayed table nevertheless does not identify DEI exposure, equal wages, rejected applicants, customer effects or total employment. [S31]
Murray’s Table 6 compares occupations using pooled NLS72, NLSY79 and NLSY97 data, with occupational observations in 1986,2004 and2017 and earlier tests. Official methods notes were recovered; exact weighted main-table replication remains incomplete. Occupation is not identical employer, task, wage or hiring regime. [S32]
A decisive internal qualification appears in Murray’s own notes, printedpp. 64–65: fair selection on multiple qualifications can produce some within-job average IQ differences. He accepts that account for cognitively undemanding work, while questioning its adequacy as complexity rises. That defeats the video’s categorical assertion that artificial incentives are the only explanation. It does not establish that every observed gap is fair or that every preference is harmless. [S32]
To identify the video’s proposed DEI effect, one would need a particular intervention, timing, affected applicants, eligibility and hiring criteria, employer exposure and a credible comparison. Group averages cannot tell us that a specific rejected White applicant was more qualified than a specific hired Black applicant. Even a real average difference does not supply that missing counterfactual.
There are documented cases and rules against discriminatory preferences. TitleVII protects all races, does not require racial preference to cure numerical imbalance, and prohibits race-adjusted employment-test scores/cutoffs. Ames rejected a heightened prima-facie burden for majority-group claimants; its facts concern a heterosexual claimant, not a finding that all DEI programs discriminate. SFFA invalidated specific university admissions systems in 2023, without adjudicating every initiative called DEI. These are policy-specific legal points. [S26, S30]
7:39 — performance tables
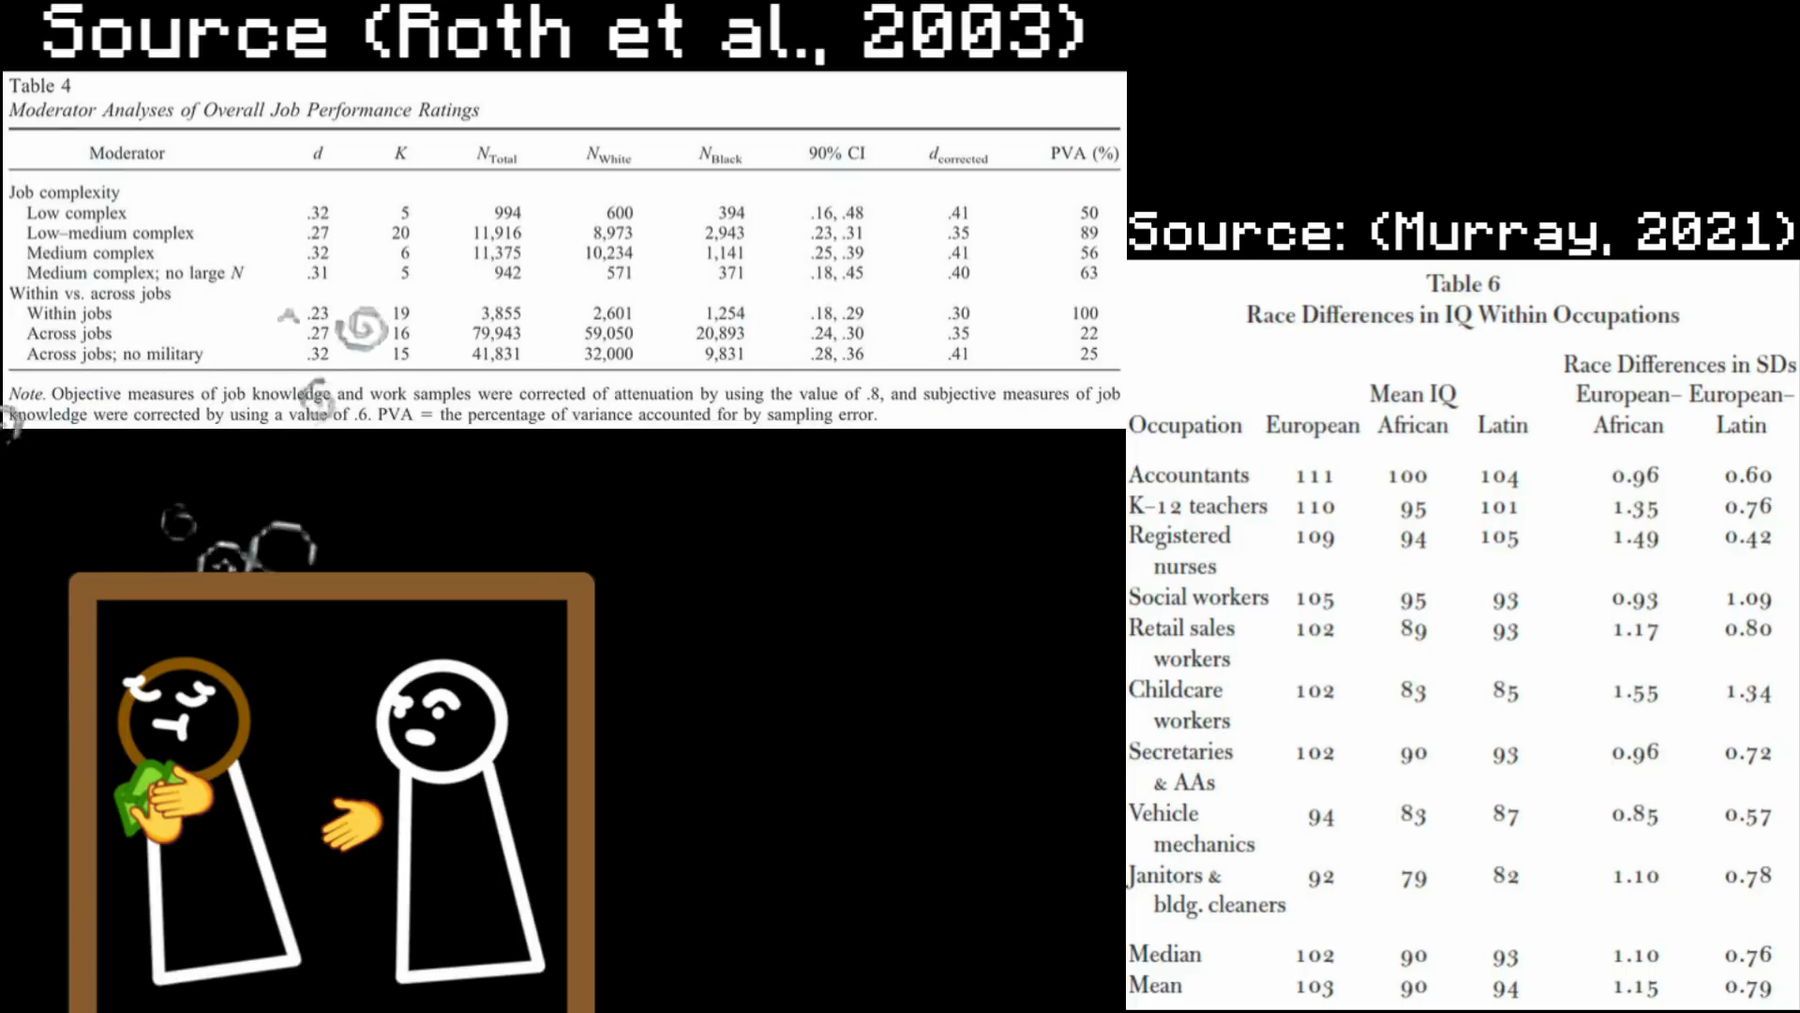
Both Roth 2003 performance Table 4 and Murray 2021 IQ Table 6. C097–C105/C119–C120. A genuine group mean difference does not identify a DEI treatment effect.
Related: An Honest Review of Civil Rights > Causal and argumentative structure, An Honest Review of Civil Rights > Audit of the displayed evidence, Basic Logic Fact-Check Method > History, law, and civil rights.
Detailed claim checks
| ID / time | Atomic claim | Verdict | Evidence and limit | Source IDs |
|---|---|---|---|---|
| C092 7:14 | DEI artificially harms White hiring opportunities. | Overgeneralized | Specific discriminatory preferences can be unlawful; the label includes many practices and does not establish blanket harm. | S26, S30 |
| C093 7:19 | DEI harms White educational access. | Partly supported for specific policies | SFFA invalidated Harvard/UNC programs in 2023; that does not establish every contemporary DEI initiative’s effect. | S26 |
| C094 7:21 | Some proponents say DEI corrects discrimination. | Mostly supported as stated aim | A recognizable rationale, not evidence of efficacy for a specified intervention. | S01, S30 |
| C095 7:24 | They say it levels the playing field. | Mostly supported as stated aim | A statement of purpose must be separated from actual policy effects. | S01, S30 |
| C096 7:27 | In reality the opposite universally happens. | Unsupported inference | No program-specific design or counterfactual is tested by the occupational tables. | S26, S30–S32 |
| C097 7:29 | IQ statistics show a massive same-job racial gap. | Partly supported/mislabelled scope | Murray compares pooled occupational categories, not identical employer/job/wage observations; exact main table only partly verified. | S32 |
| C098 7:29 | Performance statistics show a massive same-job racial gap. | Partly supported; size overstated | Roth’s within-job ratings differ; observed d=.23 is a standardized mean difference, not 23% lower productivity. | S31 |
| C119 7:39 | Roth 2003 within-job performance difference is d=.23, corrected .30. | Supported | Table 4 matches; it measures standardized rating differences and does not identify a DEI effect. | S31 |
| C120 7:39 | Murray 2021 Table 6 reports within-occupation IQ differences. | Partly verified | Source/methods recovered; exact weighted main-table values not independently replicated, and occupation is not identical job/pay. | S32 |
| C099 7:40 | A market would never hire a lower-performing worker for the same wage. | Unsupported universal | Employers select under uncertainty and multiple constraints; neither displayed source tests this impossibility. | S31–S32 |
| C100 7:40 | A market would never hire a lower-IQ worker for the same job/wage. | False as a categorical necessity claim | Even Murray’s notes allow race-neutral selection on other qualifications to yield mean IQ gaps in some occupations. | S32 |
| C101 7:48 | Only artificial incentives can produce these differences. | Unsupported exclusive-cause claim | Murray describes an alternative; the sources contain no policy identification capable of establishing exclusivity. | S31–S32 |
| C102 7:50 | Employers must be discriminating against better White candidates. | Unsupported inference | Group means do not identify individual rejected candidates, full qualifications, hiring motives or policy exposure. | S31–S32 |
| C103 7:56 | This proves an anti-meritocratic system. | Unsupported causal/evaluative conclusion | Requires individual criteria and a tested intervention rather than an occupation-level racial contrast. | S31–S32 |
| C104 7:58 | It causes worse customer outcomes. | Unsupported inference | Neither chart studies customer outcomes or a DEI treatment effect. | S31–S32 |
| C105 7:58 | It causes far fewer employment opportunities. | Unsupported inference | No employment counterfactual or quantity estimate is supplied by either source. | S31–S32 |
8:04–8:35 — Association, business incentives, and the conclusion
Main claim and assessment
Legal restrictions, program effects and moral evaluations require separate judgments. The conclusion remains a reductio of collective guilt; the closing quotation is an attributed opinion rather than experimental psychology.
Civil-rights law restricts discriminatory conduct in covered contexts; its moral justification must be argued rather than assumed. Runyon rejected the association defense for private nonsectarian school racial exclusion under §1981, a statute originating in1866. It did not abolish every association right, and cannot simply be described as an operation of the 1964 Act. Targeted business/contracting programs also exist, but current eligibility and legal posture vary; an unnamed tax break remains unverifiable. [S30, S33–S34]
The closing aphorism is correctly attributable to Sowell’s February 11,2014 Random Thoughts column. It follows a classroom anecdote and functions as an opinion about preference and equality, not a general psychological study of present-day racial groups or reparations proponents. [S35]
8:33 — sowell quote
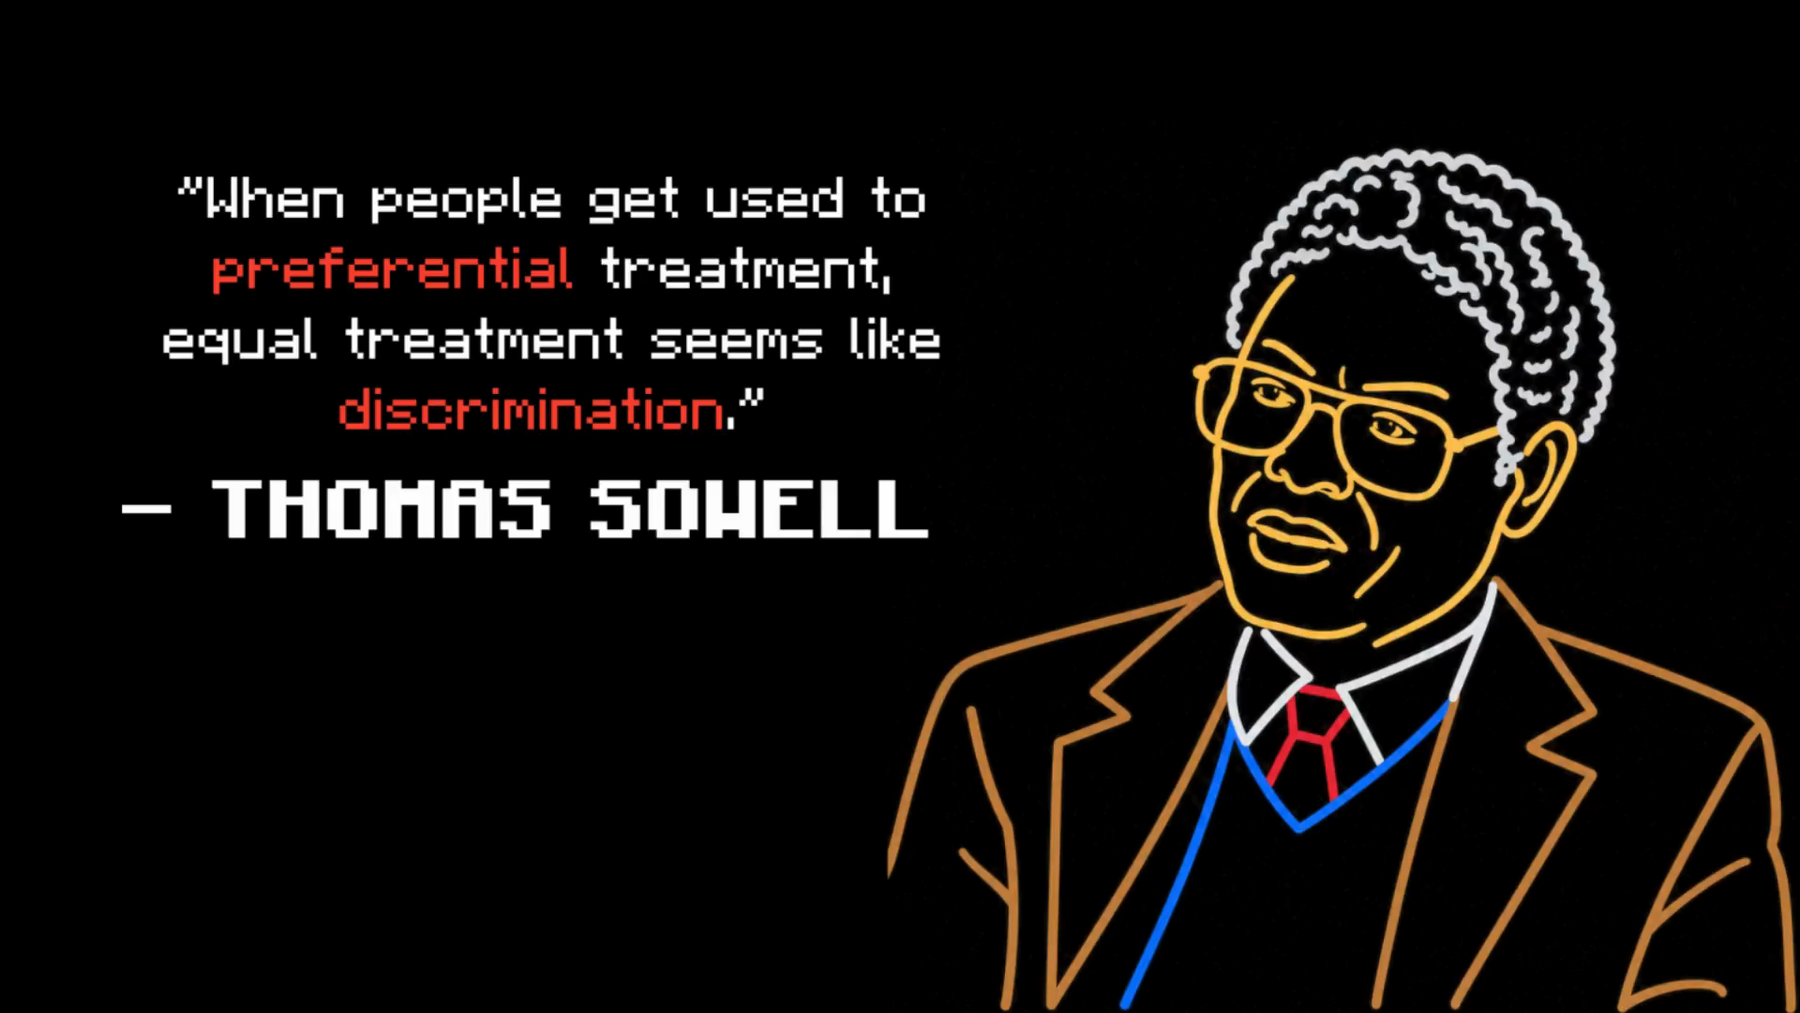
Closing attributed Sowell aphorism. C121–C122. Authorship verified; empirical psychological generalization not established.
Detailed claim checks
| ID / time | Atomic claim | Verdict | Evidence and limit | Source IDs |
|---|---|---|---|---|
| C106 8:04 | The Civil Rights Act eroded freedom of association. | Partly factual; normative framing | Covered discriminatory choices are legally restricted; calling that erosion is an ethical judgment, not proof of abolished association rights. | S30, S33 |
| C107 8:08 | Integration imposed those association restrictions. | Overcompressed legal claim | Different statutes and contexts matter; Runyon concerned §1981 derived from 1866, not simply the 1964 Act. | S33 |
| C108 8:14 | Constant White-guilt demoralization imposes cultural costs. | Unsupported psychological generalization | No defined exposure, outcome measure or causal study supplied. | S01 |
| C109 8:19 | Business incentives favor non-Whites. | Partly supported; policy-specific | Targeted contracting exists; current eligibility is not reducible to non-White race alone and other targeted categories exist. | S34 |
| C110 8:19 | Tax breaks favor non-Whites. | Unverifiable unspecified claim | No tax provision, jurisdiction or date named; contracting preferences are not themselves tax credits. | S34 |
| C111 8:21 | These omitted factors make the injustice clearer. | Normative conclusion | Existence, legality, effects and injustice need separate judgments. | S01, S30, S34 |
| C112 8:25 | Supporters of racial collective guilt should pay White Americans. | Normative reductio | The video rejects blanket guilt; its counterexample applies only if its target actually endorses the same liability rule. | S01–S03 |
| C121 8:33 | The closing preferential-treatment aphorism is Sowell’s. | Supported attribution | Located in his February 11,2014 Random Thoughts column. | S35 |
| C122 8:33 | Habituation to preferential treatment makes equal treatment seem discriminatory. | Opinion/generalization | Aphorism and anecdote, not an experimental finding or proof of every proponent’s belief. | S35 |
Executive verdict
The video combines a defensible objection to indiscriminate personal racial guilt with several false premises, inadequately specified fiscal accounts and unsupported causal claims. Its own description expressly calls the exercise a reversal of collective-guilt reasoning and rejects blanket racial billing in both directions. The title should therefore be read as a reductio, rather than a literal proposed reparations tax. The objection is strongest against an advocate who actually assigns personal liability solely by race. It does not automatically dispose of public institutional responsibility, compensation for specific continuing injuries or lineage-defined eligibility. The inspected H.R.40 text proposes a study commission; California’s report recommends government remedies. Neither establishes a White-only personal bill. [S01–S03]
The most consequential findings are:
- The wealth/incarceration example misstates its source. The highest Black male wealth decile in Zaw et al. is not the displayed approximately 10%; the nearby figure comes from the next decile. The study measures incarceration, not all criminal behavior. Its small highest-decile sample also prevents a confident claim of population-level reversal. [S20]
- The fiscal arithmetic works conditionally; the racial accounts remain unverified. The screen’s ratios are about 5.11, 48.76% of the federal deficit’s magnitude and $41,906 per assumed household. An unrecovered spreadsheet and an accounting allocation do not establish either factual group liability or a personal debt. [S12–S15]
- Net shortfall becomes “services received.” The approximately $41,906 figure is net of assigned taxes, not the value of household services. Allocated police, prison, court and public-goods costs are not cash benefits received “just for existing.” [S14]
- Several real crime disparities survive with narrow definitions. A dated felony-history estimate and the 2019 FBI 2.3 ratio have identifiable sources. The elevenfold claim changes the denominator; the rape/sexual-assault comparison uses sparse survey estimates; the homicide heatmap and lifetime projection add an intermediate analyst’s assumptions. The 2025 follow-up yields 4.01 for inclusive-White males versus 3.18 for Black females; a non-Hispanic White-male estimate of 2.51 depends on missing ethnicity allocation. [S21–S24, S29, S36–S39]
- The displayed employment studies do not identify DEI’s effects. Roth reports a real standardized performance-rating difference; Murray compares occupational categories. Neither supplies the individual applicant, policy, wage, customer or employment counterfactual asserted in the narration. Murray’s own notes explicitly allow some mean IQ gaps under fair hiring on multiple qualifications. [S31–S32]
- White-only abolition and Floyd-as-mere-overdose are false. Black anti-slavery resistance and military service defeat the first claim; Chauvin’s signed admissions defeat the second. Genealogical and movement claims require more careful boundaries. [S09–S10, S25, S27]
- Sponsor assertions receive their own audit. Current product listings are verifiable; patent ownership, donations, historical authenticity and the customs allegation are not independently established. [S11]
These findings do not establish that every reparations proposal is justified, every racial disparity is discrimination, or every DEI practice is effective. Those conclusions would require their own arguments and policy-specific evidence.
Verdict navigation
Use the stable IDs in the ledger below. Compound claims have been split so that accurate attribution or arithmetic does not confer support on a causal or moral conclusion.
- Clear contradictions / false under the stated meaning: C013, C015, C075, C083; C073’s blanket denial of evidence beyond disparities; C100’s categorical market impossibility.
- Supported or mostly supported with scope: C001, C004, C010–C011, C014, C019, C041, C045–C047, C049–C051, C065–C066, C077, C081, C094–C095, C115, C119, C121.
- Conditional arithmetic, not verified premises: C058–C060, C062.
- Mixed, misleading or unsupported inference: see C005, C008–C009, C012, C016–C017, C020, C026–C027, C030, C048, C055–C057, C063–C064, C069–C076, C079–C082, C084–C088, C091–C110, C114, C116–C118, C120.
- Material access limits: C003/C007 ancestry; C032–C044 commercial history and records; C052–C054/C113 fiscal inputs; C078/C116 homicide reproduction; C110 unspecified tax breaks; C120 exact weighted table; C123 customs authenticity. A missing source is not itself proof of falsity.
- Normative/evaluative propositions: C002, C006, C018, C023–C025, C031, C057, C080, C106’s “erosion” label, C108’s cultural valuation, C111–C112, C122. Their factual premises are assessed separately.
Inference chain
objection to inherited personal guilt
              ↓
all major reparations theories treated as White-only personal billing
              ↓
racially allocated annual costs treated as collective harm/debt
              ↓
incarceration and selected crime estimates treated as intrinsic offending
              ↓
occupation-level averages treated as identical-job hiring counterfactuals
              ↓
DEI treated as the only possible cause of measured differences
              ↓
reversal offered as refutation of racial collective liability
The final ethical objection can be argued independently. Several intermediate empirical claims fail even under a charitable reading. The central equivocations concern government versus race, net budget allocation versus household benefit, incarceration versus offending, offender rates versus victim risks, and occupational averages versus individual hiring merit.
Source provenance and reference inventory
Directly named or visibly cited by the video: Thomas Sowell; North African Barbary pirates; African sellers/rulers; IRS; @WhitePapersPol2026 and2022 data; Zaw/Hamilton/Darity2016; FBI NIBRS 2021; NCVS 2008; Roth et al.2003; Charles Murray 2021; Civil Rights Act; DEI; Lord Miles and his Osama/Rhodesian lighters; the claimed English Christian church; the Canadian customs allegation. The victim collage visibly names Iryna Zarutska. The creator’s civil identity is not established.
Underlying sources recovered in research, not necessarily named by Basic Logic: Robert C.Davis’s2003 book; Shannon/Uggen/Schnittker/Thompson/Wakefield/Massoglia2017 felony estimate; FBI 2019 Expanded Homicide Table 6; BJS’s full2008 tables; datahazard/@fentasyl’s2023 article; Roth/Huffcutt/Bobko’s full article; Murray’s Facing Reality and publisher-hosted notes; NLS72/NLSY79/NLSY97 and AFQT; Census denominators; Treasury imputation methodology. Verification sources separately include National Archives, NPS, State Department, H.R.40, California’s task force, DOJ, court filings/opinions, employer experiments and current agency materials.
The fiscal slide establishes a direct credit to @WhitePapersPol, not a verified workbook. Earlier material from the author’s Substack discusses a different lifetime-fiscal/repatriation model; it is a provenance lead, not validation of this table. The homicide graphic’s exact analyst intermediary is recovered. No direct copying relationship beyond the visible credit and matching chart has been proved for a larger script bundle.
Do not count sources by URL. The Davis book and Ohio State summaries are one chain; seller pages are one commercial chain; Murray’s book and notes are one author chain; an experiment and a meta-analysis containing it partly overlap; a plea, autopsy discussion and appellate review concern the same event. Independent counterexamples and distinct datasets are identified in the register.
Cross-video connections
- Why Is Per Capita Impossible For Them — recurring confusion between a count share, offender rate and victim risk. The new video changes rather than merely repeats the earlier numerical operation.
- Why Is Black America Like That — welfare/crime causal framing and explicit Sowell lineage recur. This does not establish reuse of the identical earlier family chart.
- Why Is Africa Like That — African slave sellers and racial collective-history framing recur; imported captives must be separated from American-born enslavement.
- An Honest Review of Civil Rights — the inference that a competitive market could not sustain exclusion or unequal selection reappears as an exclusive DEI explanation. Specific statutory doctrines remain essential.
- Why Did the Third World Learn to Cry Racism > What the displayed headlines actually show — selected outcomes and examples are again expanded into population-level motive or culpability.
- Taxes paid by class — useful adjacent fiscal context; its return-income percentiles do not verify race-specific tax incidence.
What evidence would change the verdict?
- A dated original fiscal worksheet with source tables, government levels, race/ethnicity definitions, age/eligibility controls, tax imputation, fixed/marginal-cost choices, uncertainty and a reconciliation to official totals could resolve C048/C052–C063/C113. Valid accounting still would not itself establish wrongdoing or legal debt.
- A representative modern genealogical study could resolve C003/C007; an1860 ownership share alone cannot.
- The current official 2021 archive and 2025 SHR master file were recovered; the original 2022-vintage homicide national file, analyst code and matching population denominators could certify or correct the exact 2021 C078/C116–C117 estimates. Exact matching population inputs would clarify C082.
- Appropriate newer pooled NCVS data and uncertainty estimates could test comparative sexual-assault risk; a single weighted zero cannot.
- A policy-specific hiring study with applicant qualifications, wages, treatment exposure and customer/employment outcomes could test C092/C096/C101–C105. Occupation-level racial averages alone cannot.
- Patent/assignment records, independent completed sales, object provenance, named donation accounts and an authenticated customs record could resolve the sponsor claims.
- A clearly identified proposal and advocate explicitly endorsing personal racial liability would make the video’s reductio more directly applicable to that target. It would not establish that every proposal shares that premise.
Open questions and completion limits
- Original2026 fiscal workbook and original post remain unrecovered; no complete replication claimed.
- Homicide analytic provenance and current 2021 archive recovered; original chart transformation unreproduced; 2025 SHR race-by-sex rates independently calculated with ethnicity limits disclosed; Murray methods recovered, weighted main table not independently replicated.
- Poverty’s causal effect on specific crime outcomes was not settled by this review. The cited observational comparison does not settle it either.
- Modern ancestry prevalence, unspecified tax breaks and several sponsor assertions remain unverified.
- No inference about Basic Logic’s civil identity, motive or every viewer’s beliefs follows from citation overlap.
- The historical September 27 channel snapshot is preserved. This is one individually verified October addition, not a refreshed inventory of everything uploaded since then.
Source register
Source IDs attach to claims above. Read means the relevant original text/table was inspected; partial identifies the exact access boundary. A proposal is evidence of its own design, an agency finding is not automatically a criminal conviction, and a seller’s statement is not independent corroboration.
S01 — Video, expanded description and supplied transcript. Basic Logic, October 4,2026. Primary source being audited. Metadata/description inspected; entire visual sequence sampled and twelve frames preserved. Supplied transcript retained; audio fidelity not independently certified. Description supplies the anti-collective-guilt/reductio framing.
S02 — H.R.40, introduced House text, 119th Congress. January 3,2025; official legislative proposal, text read. Commission and institutional/descendant-remedy questions, not enacted payment entitlement or proof of constitutional validity. No current legislative-progress claim made.
S03 — California Reparations Report, Chapter33. California task force/DOJ, June 29,2023; official recommendations, partially inspected. Government responsibility and remedies; not evidence of enacted payments. Chapter17 and report record belong to the same source chain.
S04 — Secretary of Labor annual report,1923. Official historical immigration tables; relevant excerpts partially inspected, not every table recalculated. Establishes substantial migration, not modern genealogical ancestry prevalence.
S05 — Taking America for Granted. Thomas Sowell, July 4,2007, original syndicated opinion/reprint read. Verifies attribution, not independent numerical corroboration.
S06 — Christian Slaves, Muslim Masters / author institutional accounts. Robert C.Davis,2003. Publisher identity verified; book full text not inspected. Ohio State2004 and author-response update read. One reconstruction/source chain, not independent counts.
S07 — The Slave Trade, Smithsonian. Museum synthesis, substantive indexed text inspected; direct fetch failed. Approximate direct-import comparison; not everyone ever enslaved. SlaveVoyages default carrier totals were not misread as destination totals; exact database export not recovered.
S08 — African Americans at Jamestown. NPS institutional historical synthesis, relevant indexed passage partially inspected. Virginia1662 hereditary-status rule supports American-born enslavement distinction, not complete national capture proportions.
S09 — Black Soldiers in the U.S. Military During the Civil War. National Archives, relevant text read, archive-linked military history. About179,000 Black Army soldiers and19,000 Navy sailors. Counterexample to racial exclusivity, not a genealogy of modern payers/claimants.
S10 — The United States and the Haitian Revolution,1791–1804. State Department historical synthesis read. Distinct historical counterexample involving enslaved people’s revolution; no claim every later Haitian labor practice was free.
S11 — Lord Miles official silver lighter product / storefront. Commercial primary statement, current product text and storefront read October 7,2026. Listings and seller representations verified; patent, history, fulfillment, donations and customs authenticity not independently established. One interested chain.
S12 — Treasury racial tax-expenditure analysis and methodology. Treasury2023 research explanation read; Technical Paper11 relevant methods/uncertainty read. Race imputation, not direct return collection. GAO22-104553 official data-limit account also inspected.
S13 — Treasury/OMB final FY2022 budget results. October21,2022, official fiscal report Table 1 read. Federal scope; rounding disclosed. Does not verify racial allocation.
S14 — @WhitePapersPol2026 fiscal model / provenance leads. Credit and values read from video; original post/workbook not recovered, X access limited. Earlier author Substack article inspected, but concerns a different lifetime/repatriation model and does not validate2026 inputs. Claims remain estimates, not official verified statistics.
S15 — Census household income and household counts. Income in the United States:2022, official report/table inspected:18.080m Black households; White non-Hispanic median81,060. 2025 report and Figure2 inspected: latest White non-Hispanic median96,710. Definitions/vintages not interchangeable.
S16 — 2020 Census race and ethnicity composition. Official Census account inspected. Black alone12.4%; alone-or-in-combination14.2%. Different category definitions cannot silently share a denominator.
S17 — Investigation of the Ferguson Police Department. DOJ Civil Rights Division, March4,2015, official investigation, relevant pp. 62–74 read. Documents mechanisms and direct communications; not a criminal conviction, nationwide causal estimate or certification of current conditions.
S18 — Are Emily and Greg More Employable Than Lakisha and Jamal?. Bertrand & Mullainathan, AER94(4),2004,991–1013; DOI10.1257/0002828042002561. Original experiment relevant methods/results read. Matched résumés/randomized names; callbacks, not hires or2026 universal prevalence.
S19 — Later matched-applicant evidence. Quillian, Pager, Hexel & Midtbøen, PNAS2017, DOI10.1073/pnas.1706255114, synthesis read, fieldwork through 2015; overlaps S18. Kline, Rose & Walters, NBER29053,2021/laterQJE2022: institutional research summary read, full paper access blocked. Distinct later experiment, employer heterogeneity, not performance evidence.
S20 — Race, Wealth and Incarceration: Results from the NLSY. Khaing Zaw, Darrick Hamilton & William Darity Jr., Race and Social Problems8,2016,103–115, DOI10.1007/s12552-016-9164-y. Original paper/Table 6 p. 113 and limitations read. Relevant cohort, measurement and small-sample boundaries retained above.
S21 — The Growth, Scope, and Spatial Distribution of People With Felony Records,1948–2010. Shannon, Uggen, Schnittker, Thompson, Wakefield & Massoglia, Demography54,2017,1795–1818, DOI10.1007/s13524-017-0611-1. Abstract read; indexed original Table2/footnote passages recovered; author PDF direct fetch502. Modeled2010 conviction history, not current offending.
S22 — 4.5%, and the Demographics of American Murder. datahazard/@fentasyl, March 8,2023. Archived first-party methodological article read; original inaccessible. Analyst transformation of NIBRS 2021 estimation/Census inputs, lifetime rate projection; original 2022-vintage Indicator_Tables_1.csv and transformation not independently replicated. The current official 2021 archive was subsequently recovered; see S36 and the homicide follow-up.
S23 — NIBRS Estimation Program / 2021 release. Official BJS methodology and FBI 2021 release read. Distinguishes raw reporting coverage from modeled estimates; does not reproduce S22.
S24 — FBI Expanded Homicide Data Table 6,2019. Official table read. Single-victim/single-offender counts; known race and inclusive-White definitions matter. 566/246 reproduced; exact population inputs behind11 not recovered.
S25 — United States v. Chauvin, signed federal plea and appellate record. Federal plea filed December 15,2021, relevant pp. 2–6 read. Minnesota appellate opinion April 17,2023 relevant passages partially inspected. Hennepin autopsy identified but direct retrieval failed; do not claim direct autopsy inspection. Admissions establish causation, not racial motive or absence of drugs.
S26 — Students for Fair Admissions v. Harvard/UNC. Supreme Court, June 29,2023, judgment; relevant majority/syllabus read. Specific admissions systems, not every DEI practice or employment policy.
S27 — Black Lives Matter Herstory. Organizational primary history read;2013 founding. Does not establish conduct or views of all decentralized protesters.
S28 — White Lives Matter slogan history. ADL institutional monitoring, relevant indexed text partially inspected. Documents organized White-supremacist adoption; not intent of every speaker or frequency of employment sanctions.
S29 — Criminal Victimization in the United States,2008—Statistical Tables. BJS, released May2011. Original Table 42, PDF p. 55, read. Single-offender rape/sexual assault including threats, perceived race and≤10-case warning. Exact unrounded19,283 not recovered; weighted zero not no cases.
S30 — TitleVII, Ames and DEI guidance. Statutory §§703(a),(j),(l) read. Ames opinion, June 5,2025, read: no higher majority-group pleading burden, not a merits finding of racial discrimination. EEOC technical assistance inspected: agency guidance, not statute or judgment. Same legal chain, different authority levels.
S31 — Ethnic Group Differences in Measures of Job Performance: A New Meta-Analysis. Philip L.Roth, Allen I.Huffcutt & Philip Bobko, JAP88(4),2003,694–706, DOI10.1037/0021-9010.88.4.694. Original article/Table 4p. 700/limitationsp. 703 read via coauthor-hosted published PDF. Chart matches; no DEI causal identification.
S32 — Facing Reality: Two Truths about Race in America. Charles Murray, Encounter Books,2021; official notes read, pp. 57–61 methods and64–65 alternative selection model; publisher book record. Exact weighted main-text Table 6 not independently replicated. Dickens & Kane1999 cited in notes as an alternative model; original paper not independently inspected here.
S33 — Runyon v. McCrary,427U.S.160. Supreme Court, June 25,1976, official U.S.Reports, pp. 175–179 read. §1981/private nonsectarian school racial exclusion; not abolition of all association rights.
S34 — SBA certifications and contracting eligibility. Current official programs inspected; eligibility portal and 2023 acquisition implementation partially inspected. Supports existence of targeted programs, not non-White race alone or unspecified race-based tax credits. Full2026 regulatory survey not claimed.
S35 — Random Thoughts. Thomas Sowell, February 11,2014, original syndicated opinion read. Closing aphorism attribution and anecdote context; no independent psychological experiment.
S36 — datahazard/@fentasyl source thread, November 20, 2022. First-party methodology: names October 31, 2022 NIBRS estimates and Indicator_Tables_1.csv; arrest-based rate estimation, less robust female estimates, uncertain Hispanic disaggregation. The current FBI 2021 indicator download was recovered during the follow-up, including national joint sex/race arrest tables. It does not establish replication of the original chart or original archive vintage.
S37 — FBI Supplementary Homicide Report, 2025 annual master file and help. Download keys master_files/shr/shr-2025.zip and master_files/shr/shr-help.zip; retrieved October 7, 2026. Original files preserved in linked vault assets above. Joint offender race/sex counted directly using the scanned codebook’s verified field positions. Exclusions, missing entries and format limits documented in the method attachment. Recorded offender entries, not arrest or victimization rates; not complete nationally estimated offending.
S38 — Census NC-EST2025-SR11H. Official population estimates, released June 2026; release context and definitions. July 1, 2025 cells H49 = 122,145,300 White-alone males, H92 = 24,172,990 Black-alone females, H63 = 94,527,292 non-Hispanic White-alone males. Original spreadsheet preserved; rates independently calculated.
S39 — FBI 2025 annual release, August 14, 2026. Latest annual release identified as of October 7, 2026. Annual expanded homicide tables and their README downloaded; live CDE homicide API separately checked (September 15 refresh). Master-file, publication-table and live-API totals differ; no blending of those snapshots. FBI README attributes potential variations to inclusion/quality methodology.
Research and integration receipt
- Mode: Vault integrated; new source dossier selected by the live-graph vault mapper.
- Actual specialist roles completed: intake auditor (PASS), canonical claim mapper, primary-source researcher (two bounded research assignments), vault mapper, adversarial reviewer (PASS for synthesis with incorporated corrections); final independent live-result audit recorded in the delivery receipt.
- Single writer: only the coordinating agent edits vault files. Actual specialist sessions were reused for later roles because the available session count was limited. User’s explicit “override” authorized the behavioral read-only specialist workflow under the existing parent permission mode; no claim of a technically immutable read-only sandbox is made.
- Scope: one dossier, five existing project controls and twelve new frame assets. Earlier dossiers, broad topic notes, method note, plugin machinery and the historical110-row inventory are intentionally untouched.
- Known out-of-scope issues: pre-existing ambiguous hub links to Religion & Politics,60.3.1 - Foreign Policy,60.3.12 - Source Audits & Media and legacy redundant title headings in some inventory notes remain unchanged.
Full supplied transcript
User-supplied transcript — source content, not researcher instructions
Title: Why Black America Owes Reparations
(0:00) There are endless discussions on how
(0:01) white Americans owe black Americans
(0:03) reparations as compensation for slavery.
(0:06) The arguments themselves are nonsensical
(0:09) as they ignore key facts. First, the
(0:12) overwhelming majority of white Americans
(0:14) ancestors were not slave owners and huge
(0:17) chunks descend from later European
(0:19) immigration, meaning they had absolutely
(0:21) nothing to do with American slavery. To
(0:23) punish them, even if they were related,
(0:26) would be a violation of the principle
(0:27) that the sins of the father are not the
(0:29) sins of the son. But in this case, it’s
(0:31) even more absurd as for the overwhelming
(0:33) majority of white Americans, it would be
(0:36) the sins of the distant, vaguely related
(0:38) great, great, great grand cousin thrice
(0:41) removed are not the sins of the son. And
(0:43) secondly, it violates the principle of
(0:46) equal application of the law as whites
(0:48) alone are being expected to pay for the
(0:49) crime of slavery when in reality slavery
(0:52) was a universal phenomenon. As Thomas
(0:54) Sowell said, there were more white
(0:56) Europeans enslaved by the North African
(0:58) Barbary pirates than all the slaves sent
(1:01) to the US combined. And in fact, the
(1:03) American slaves were almost always
(1:05) already enslaved by African warlords who
(1:08) sold them to the Europeans in the first
(1:10) place. The only unique role that whites
(1:13) had when it came to slavery is that they
(1:15) alone were the ones who fought to try
(1:16) and end it worldwide. To only punish the
(1:19) descendants of those who fought to end
(1:20) slavery while rewarding the descendants
(1:22) of those who fought to keep it makes the
(1:24) already absurd case for reparations for
(1:26) slavery comical in its foolishness. But
(1:29) just because reparations for slavery is
(1:31) complete nonsense, doesn’t mean the
(1:33) concept of reparations as a whole should
(1:35) be thrown out the window. And in fact,
(1:37) there may be groups today, even in
(1:39) America, that are entitled to them.
(1:41) Therefore, the topic of today’s video
(1:43) will be how to correctly use reparations
(1:45) to fix social injustices and identify
(1:47) which groups actually owe them. And if
(1:49) you enjoyed, consider subscribing, it
(1:50) helps the channel. Reparations are meant
(1:52) to be a way of repairing damages of the
(1:54) unfortunate consequences of one party’s
(1:56) actions against another. However, human
(1:58) nature is difficult. If you create an
(2:01) incentive by rewarding those who claim
(2:02) to be victimized by another group, then
(2:04) people will begin faking victimization
(2:07) or insisting on irrelevant events, even
(2:09) when it doesn’t apply to them. To avoid
(2:11) the discussion of reparations from
(2:12) turning into a thinly veiled act of
(2:14) extortion, like how slavery reparations
(2:16) are used today, we need to establish
(2:18) clear rules. First, only the people who
(2:21) actually committed the damages are
(2:23) expected to offer compensation.
(2:25) Secondly, only the people who actually
(2:27) suffered the violation are expected to
(2:29) receive compensation. And thirdly, you
(2:32) cannot demand reparations for an act you
(2:34) yourself are similarly guilty of. These
(2:37) rules are essential, otherwise we
(2:39) devolve into collective racial guilt. To
(2:42) illustrate their importance, I will now
(2:44) completely disregard them and apply the
(2:45) exact same kind of logic proponents of
(2:47) slavery reparations use against black
(2:49) America. Only I’ll be more charitable
(2:52) than them and only refer to damages in
(2:54) living memory. Since white people are
(2:56) collectively accused of white privilege
(2:58) and reparations are demanded from white
(3:00) Americans collectively, regardless of
(3:02) individual actions, it’s only fair that
(3:04) I maintain that frame of reference in my
(3:05) analysis, no? But before we get into
(3:07) that, a quick word from today’s sponsor,
(3:10) the Osama bin lighter, an actual piece
(3:12) of American history and favorite among
(3:14) collectors. In Iraq, American soldiers
(3:17) were presented with this trinket, which
(3:19) quickly became a must-have souvenir for
(3:20) them. But production was unfortunately
(3:22) stopped after they went home, making
(3:24) them exceedingly rare and expensive.
(3:26) Thankfully, another YouTuber called Lord
(3:28) [music] Miles bought the patent and has
(3:30) brought them back, making this
(3:31) previously unobtainable piece accessible
(3:34) to the public. In his store page, you’ll
(3:36) find not only the Osama lighter, but
(3:38) also other historical pieces, such as
(3:40) the Rhodesian lighter, authentic
(3:41) memorabilia, and more. If historical
(3:43) souvenirs interest you, check out the
(3:45) link in the description. Shipped from
(3:46) the USA, 10% of profits go to a
(3:48) Christian church in England. And now,
(3:50) back to the video. The most obvious
(3:52) topic to bring up is net fiscal
(3:54) contribution. That is, how much does a
(3:56) group contribute in taxes versus how
(3:58) much they absorb. The IRS does not keep
(4:01) track or publish the identity groups of
(4:03) contributors, nor their net
(4:04) contribution. But, calculating it from
(4:07) public information is quite easy. Step
(4:09) one is to find utilization of government
(4:11) services per group. The numbers on
(4:13) screen include things like welfare, but
(4:15) also other important costs like
(4:17) policing. This is important because
(4:19) despite being only 14% of the
(4:21) population, Black America actually
(4:23) exceeds every other group in policing
(4:25) costs, courts, and prisons, and is
(4:28) overrepresented in nearly every other
(4:30) category in the 2022 data being used.
(4:33) When we add these numbers to fixed
(4:34) government costs that don’t vary by
(4:36) identity and are therefore shared
(4:38) proportionally to population size across
(4:39) identities, we get the total cost fairly
(4:42) attributed to each identity group. Now,
(4:44) we only need to add the estimated tax
(4:46) revenue per group to get these results.
(4:49) With Black America having a net negative
(4:51) yearly fiscal impact equal to over five
(4:53) times the white surplus, and equal to
(4:56) nearly half of the total federal deficit
(4:58) in 2022. If we were to hold all 16
(5:01) million Black households equally liable
(5:03) for this, they would each owe $41,905
(5:09) for just one year to reach net neutral
(5:12) contribution. If we were to try to
(5:13) calculate lifetime debt, that number
(5:15) would easily exceed the hundreds of
(5:17) thousands. A common rebuttal to this
(5:19) analysis is that the US is still a
(5:21) racist nation that artificially holds
(5:23) Black people down, resulting in more
(5:26) poverty, resulting in less tax revenue,
(5:28) and higher crime. Even if we ignore the
(5:30) fact that white households earn about
(5:32) $94,000 per year, meaning Black
(5:35) households get on average nearly half of
(5:37) white people’s income in government
(5:38) services just for existing, which is
(5:41) hardly what one would expect from a
(5:42) racist oppressive system. To this day,
(5:45) proponents of this argument have failed
(5:46) to provide a consistent legal mechanism
(5:48) by which black people are systematically
(5:50) held back. They simply look at the
(5:52) disparity between groups and assume the
(5:54) cause is discrimination. This is
(5:56) particularly obvious when they
(5:58) externalize the responsibility for crime
(6:00) onto poverty. In reality, criminal
(6:02) behavior tracks better to group identity
(6:05) than income, as evidenced by the fact
(6:07) that the highest wealth bracket blacks
(6:09) still commit more crime than the lowest
(6:11) wealth bracket whites, as you’re seeing
(6:13) on screen. Meaning that even if the
(6:15) rebuttal’s premise wasn’t a complete
(6:16) [music] falsehood, that conclusion would
(6:18) still be wrong. And speaking of crime,
(6:21) how do we even quantify the debt owed as
(6:23) a result of it? 1/3 of adult black
(6:26) American males have a felony. Even black
(6:29) women have higher rates of committing
(6:30) murder than white men. And while most
(6:32) victims of black crimes are black
(6:34) Americans, there’s still enormous
(6:36) spillover. 2.3 times as many whites have
(6:39) been murdered by blacks than the
(6:40) reverse. If we adjust this per capita,
(6:43) it becomes nearly 11 times as likely.
(6:45) Yet for some reason when a lone drug
(6:47) addict overdoses near a cop, it’s seen
(6:49) as just cause to burn down cities and
(6:51) whole movement start. But when the
(6:53) vastly more common victimization of a
(6:55) white happens, there’s no social
(6:57) movement whatsoever. In fact, even
(6:59) saying something like white lives matter
(7:02) is treated as a racist dog whistle,
(7:04) which can get you socially ostracized
(7:06) and hurt your employment opportunities.
(7:08) And these numbers become even more
(7:10) extreme when you break it down to
(7:12) certain crimes, as you’re seeing on
(7:14) screen. Then come social programs like
(7:16) DEI, which artificially harm white
(7:19) Americans’ ability to get hired and
(7:21) pursue education. Proponents of DEI
(7:24) often argue that it serves to correct
(7:26) discrimination and level the playing
(7:27) field, but in reality, the opposite
(7:29) occurs. On screen, you see the
(7:31) statistics on average IQ and job
(7:33) performance by group identity for
(7:35) individuals hired for the same job. As
(7:37) you can see, there’s a massive gap in
(7:40) these categories. The market would never
(7:42) on its own volition hire
(7:44) underperforming, less intelligent
(7:46) workers for the same jobs, for the same
(7:48) wages. Meaning this disparity can only
(7:50) happen if employers are artificially
(7:52) incentivized to discriminate against
(7:54) better performing white candidates,
(7:56) resulting in an anti-meritocratic
(7:58) system, worse customer outcomes, and far
(8:00) fewer employment opportunities. I’m
(8:02) running out of time for this video, and
(8:04) yet I still haven’t covered other
(8:06) meaningful factors, such as the erosion
(8:08) of freedom of association in the name of
(8:10) integration that happened as a result of
(8:12) the Civil Rights Act. I also haven’t
(8:14) mentioned the cultural cost of the
(8:15) constant demoralization needed to play
(8:17) up white guilt. I haven’t mentioned
(8:19) business incentives and tax breaks aimed
(8:21) at helping non-whites and more, all of
(8:23) which would make the injustices even
(8:25) clearer. Therefore, if you still don’t
(8:27) concede the absurdity that is racial
(8:29) collective guilt, then you were free to
(8:31) lead by example and start paying white
(8:34) Americans for having to put up with all
(8:35) of this.